Annotations
Annotating the charts
Annotations in ApexCharts allows you to write custom text on specific data-points or on axes values.
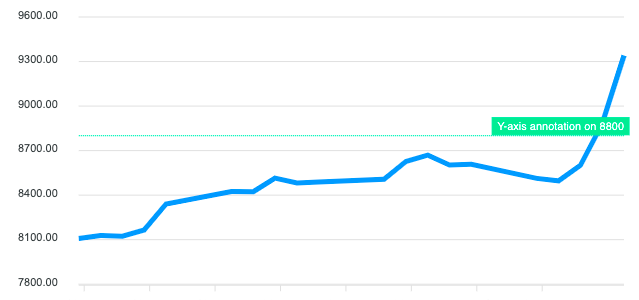
Y-axis annotations
Plotting annotations on the y-axis draw a horizontal line as well as a descriptive text label.
annotations: {
  yaxis: [
    {
      y: 8800,
      borderColor: '#00E396',
      label: {
        borderColor: '#00E396',
        style: {
          color: '#fff',
          background: '#00E396'
        },
        text: 'Y-axis annotation on 8800'
      }
    }
  ]
}
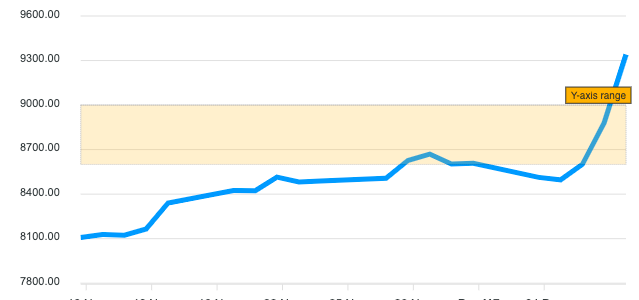
Y-axis range annotations
You can also have a y-axis range annotation which draws a rectangle instead of a line between the y and y2 values.
annotations: {
  yaxis: [
    {
      y: 8600,
      y2: 9000,
      borderColor: '#000',
      fillColor: '#FEB019',
      label: {
        text: 'Y-axis range'
      }
    }
  ]
}
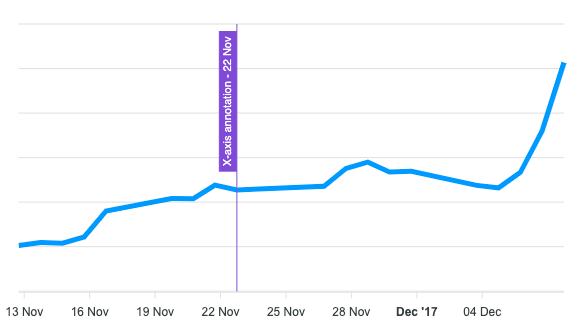
X-axis annotations
An x-axis annotation is a vertical line that is drawn on the x value of the chart. In the example below, a timestamp is passed in the x property of the annotation.
annotations: {
  xaxis: [
    {
      x: new Date('23 Nov 2017').getTime(),
      borderColor: '#775DD0',
      label: {
        style: {
          color: '#fff',
        },
        text: 'X-axis annotation - 22 Nov'
      }
    }
  ]
}
If you have plotted a category x-axis instead of a datetime, you can simply pass a String value and it will draw the annotation on the category. An example of an x-axis annotation with String value can be found on this category chart.
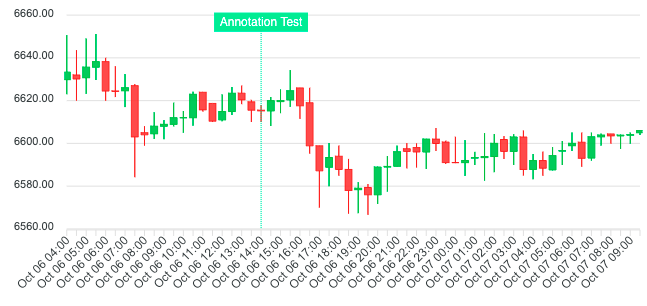
What if you have plotted a category x-axis with datetime values?
If you have date values in x-axis but you have not used xaxis.type: 'datetime', instead of passing the timestamp, you will have to pass the date string like below.
annotations: {
  xaxis: [
    {
      x: 'Oct 06',
      borderColor: '#00E396',
      label: {
        borderColor: '#00E396',
        orientation: 'horizontal',
        text: 'X Annotation'
      }
    }
  ]
}
The full example can be found on candlestick catogory x-axis
X-axis range annotations
You can also have an x-axis range annotation which draws a rectangle instead of a line between the x and x2 values.
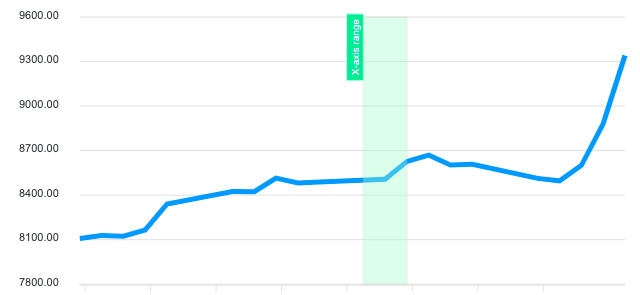
xaxis: [
  {
    x: new Date('26 Nov 2017').getTime(),
    x2: new Date('28 Nov 2017').getTime(),
    fillColor: '#B3F7CA',
    label: {
      text: 'X-axis range'
    }
  }
]
Point (XY) annotations
A point annotation, also known as XY annotation is drawn by taking into account both the x and y points on a chart. Instead of a line, a marker is drawn on top of the point which can be customized as follows
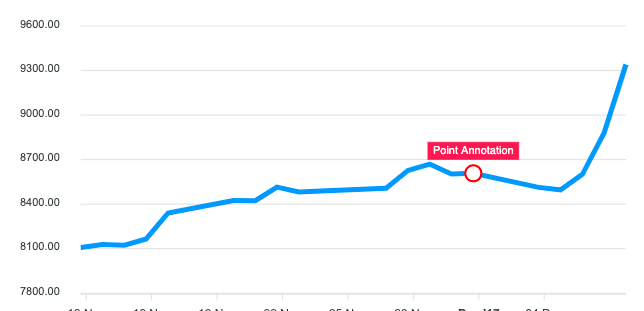
points:
[
  {
    x: new Date('01 Dec 2017').getTime(),
    y: 8607.55,
    marker: {
      size: 8,
    },
    label: {
      borderColor: '#FF4560',
      text: 'Point Annotation'
    }
  }
]
Adding annotations after the chart has rendered
The chart instance exposes methods for adding annotations at runtime, after the initial render. This is useful for adding annotations in response to user interaction or async data.
// Add an x-axis annotation (vertical line) after render
chart.addXaxisAnnotation({
  x: new Date('2024-06-01').getTime(),
  borderColor: '#FF4560',
  label: {
    text: 'Product launch'
  }
})

// Add a y-axis annotation (horizontal line)
chart.addYaxisAnnotation({
  y: 1000,
  borderColor: '#00E396',
  label: {
    text: 'Target'
  }
})

// Add a point annotation
chart.addPointAnnotation({
  x: new Date('2024-03-15').getTime(),
  y: 820,
  label: {
    text: 'Peak'
  }
})
Removing annotations
Set an id on an annotation to target it for removal later:
// Add annotation with an id
chart.addXaxisAnnotation({
  x: 400,
  id: 'threshold-line',
  label: { text: 'Threshold' }
})

// Remove by id
chart.removeAnnotation('threshold-line')

// Remove all dynamic annotations (config-defined annotations are unaffected)
chart.clearAnnotations()
Persistent vs transient annotations
By default, pushToMemory: true makes annotations survive updateOptions() and updateSeries() re-renders. Set pushToMemory: false to add a one-time annotation that disappears on the next chart update.
Full example
See the Pen Annotations Example by ApexCharts (@apexcharts) on CodePen.
For the full set of options available for annotations, see annotations configuration