Embedded analytics means putting charts, dashboards and reporting inside an application people already use, rather than sending them somewhere else to see their data. There are two ways to do it: compose visualization components into your own screens, or embed a complete analytics product through an SDK. This page covers both, and how to tell which one your project needs.
Which approach fits your product?
The choice is not really about features, it is about how much of the analytics layer you want to own. Components give you control and cost you build time. A platform gives you dashboards immediately and costs you control over the UI.
| If you need | Use |
|---|---|
| Charts, grids and maps composed into your own screens | The Apex suite |
| Control over markup, styling, theming and bundle size | The Apex suite |
| To redistribute the components inside software you sell or host | The Apex suite on the OEM plan |
| A complete analytics product integrated rather than built | Reveal |
| Dashboards without owning the dashboard layer yourself | Reveal |
If your customers need to author their own dashboards, that is the clearest signal for a platform: Apex products are developer components, so you would be building that editor yourself.
How do you build embedded analytics with Apex components?
Most embedded analytics screens come down to three surfaces: a chart for the trend, a grid for the detail behind it, and a map when the data is geographic. Those are ApexCharts.js, ApexGrid and ApexMaps. Add ApexGantt, ApexTree, ApexSankey or ApexStock when a product needs timelines, hierarchies, flows or financial charts.
They are plain JavaScript components with framework wrappers, so they mount inside whatever your application already renders. A first chart is an install and a render call:
npm install apexcharts
import ApexCharts from 'apexcharts'

const chart = new ApexCharts(document.querySelector('#revenue'), {
  chart: { type: 'area', height: 320 },
  series: [{ name: 'Revenue', data: [31, 40, 28, 51, 42, 109] }],
  xaxis: { categories: ['Jan', 'Feb', 'Mar', 'Apr', 'May', 'Jun'] },
})

chart.render()
From there, see the chart demos for the visualization types, the documentation for the API, and pricing for how the plans work.
On licensing: embedding an Apex product in software you sell or host for customers is what the OEM plan covers, as a flat annual fee per application redistributed, covering unlimited developer seats on it. The Community plan is free only for organizations under $2M in annual revenue, budget or funding. No Apex product is open source, so this is worth settling before you build rather than after.
What Is Embedded Analytics?
Embedded analytics integrates data analysis and reporting capabilities seamlessly into software applications. This approach allows users to access powerful data visualization and dashboard features without leaving their business applications, promoting a more intuitive and productive environment right in the context of their everyday business applications.
Why Businesses Use Embedded Analytics?
Embedded analytics is a versatile tool employed across industries, serving as a powerful ally for businesses that want to remain competitive. Whether in finance, healthcare, or manufacturing, embedded analytics facilitates tasks like monitoring business performance, optimizing workflows, enhancing customer experiences, and driving informed decision-making across various domains.
Benefits of Embedded Analytics
Embedded analytics offers several key benefits, making it an indispensable tool for modern businesses:
- Efficiency: Streamlines processes by integrating analytics into user applications, reducing the time to insight.
- Quicker Time to Market: Leveraging the expertise of an embedded analytics vendor allows you to bypass the lengthy and complex process of building your own analytics solution from scratch.
- Customer Satisfaction: Improves user experience by providing relevant data insights within the natural workflow.
- Cost Savings: By integrating Reveal's analytics, you eliminate the need for extensive in-house development for analytics capabilities, allowing your developers to focus on the core functionalities of your application.
- Enhanced Decision-Making: Provides real-time data insights, promoting timely and informed business decisions.
- Competitive Advantage: Keeps businesses ahead by enabling quick adaptation to market changes and customer needs through data-driven strategies.
Embedded Analytics Examples
Here are a few examples of how ISV, SaaS, and finance companies use embedded analytics to their advantage:
Embedded Analytics for ISVs
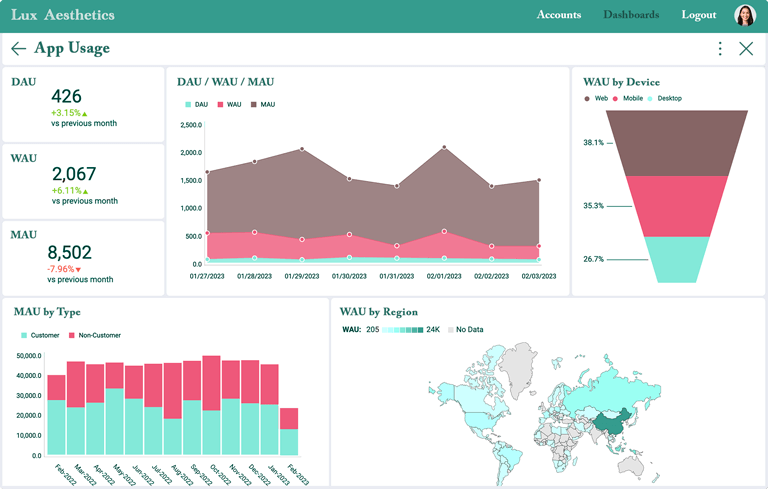
By seamlessly embedding customizable analytics capabilities into their applications, Independent Software Vendors (ISVs) can significantly elevate their software's value proposition and meet the growing demand for BI capabilities. This can enhance client retention and software renewals while unlocking new revenue streams with additional features. Furthermore, embedded analytics solutions are equipped with robust security features, ensuring data protection and regulatory compliance. This commitment to security and value creation benefits ISVs and strengthens customer trust and satisfaction.
Embedded Analytics for SaaS
Embedding powerful analytics capabilities into SaaS application ecosystems enhances operational efficiency and drives strategic growth initiatives. By leveraging data to inform decision-making processes, businesses can adapt to evolving market demands, innovate confidently, and maintain a competitive edge in their market. Moreover, data helps identify new product or service opportunities, allowing businesses to align offerings with user needs and sustain customer satisfaction over time.
Embedded Analytics in Finance
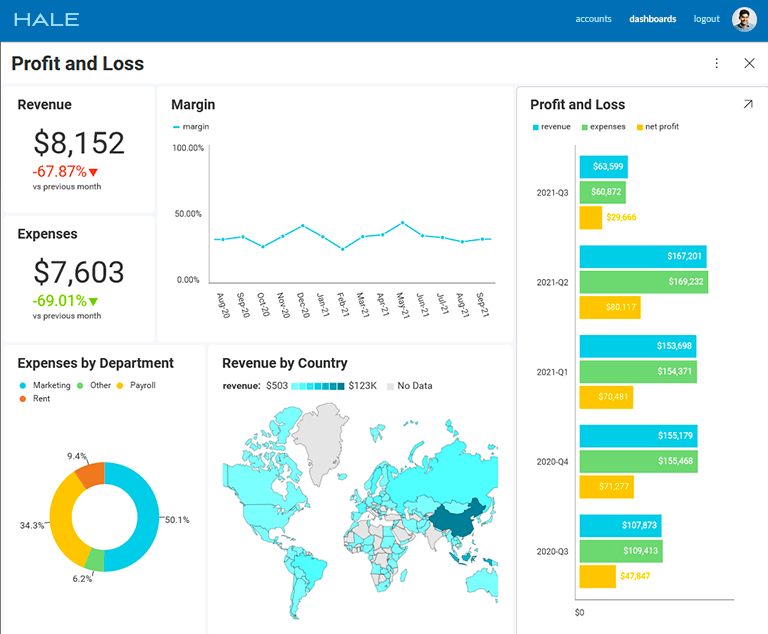
Embedded analytics is used in the financial industry to optimize budgeting, financial planning, forecasting, portfolio management, and more. Embedded finance analytics help financial services providers process and analyze key data such as customer acquisition costs, loan requests, gross profit, etc. With the insights gained, financial institutions can promote the right services to customers, adding more value to their customers and strengthening their business relationships.
Why Choose Reveal for Embedded Analytics?
Reveal is an industry-leading embedded analytics software offering a solution that transcends traditional boundaries through its advanced embedded SDK. Reveal's true embedded SDK technology surpasses the outdated iFrame integration methods, providing a robust, flexible, and secure analytics environment that is easy for everyone to use.
Imagine a retail company facing the challenge of optimizing inventory management across multiple locations. By leveraging Reveal's embedded analytics solution for retail, they seamlessly integrated advanced inventory tracking and forecasting tools directly into their point-of-sale systems. This integration empowered them to monitor stock levels in real time, predict demand fluctuations, and streamline supply chain operations. As a result, they were able to minimize stockouts, reduce excess inventory costs, and improve overall operational efficiency. Reveal enabled them to react swiftly to inventory challenges and provided insights to proactively optimize their inventory management strategies, demonstrating the transformative impact of embedded analytics in driving business success.
By choosing Reveal as an embedded analytics vendor, you can harness the full potential of your business data, ensuring that the analytics solution is not just an added feature but a core component of your operational ecosystem. This integration promises not just insights but a transformation in how your business operates, making data-driven decisions the backbone of your success.
Explore Reveal today by requesting a demo or downloading our SDK. Join the global community of businesses that have leveraged the power of embedded analytics to achieve success.
Frequently Asked Questions
What is embedded analytics?
Embedded analytics means putting charts, dashboards and reporting inside an application people already use, instead of sending them to a separate BI tool. In practice it is either a set of visualization components you compose into your own screens, or a complete analytics product you integrate through an SDK.
Do I need a licence to embed ApexCharts in software I sell?
Yes. Redistributing any Apex product inside an application you sell or host for customers is covered by the OEM plan, which is an annual fee per application redistributed, covering unlimited developer seats on it. The Community plan is free only for organizations under $2M in annual revenue, budget or funding, and no Apex product is open source.
Which Apex products are used for embedded analytics?
Most embedded analytics screens are built from three: ApexCharts.js for the charts, ApexGrid for tabular detail and drill-down, and ApexMaps for geographic views. ApexGantt, ApexTree, ApexSankey and ApexStock cover timelines, hierarchies, flows and financial data when a product needs them.
Should I build the dashboard myself or embed a BI platform?
Build it from components when the analytics are part of your product experience and you need control over layout, styling and bundle size. Embed a BI platform when you need dashboards working quickly and do not want to own the dashboard layer, the data connectivity or an end-user report designer.
Can end users build their own dashboards with Apex components?
Not out of the box. Apex products are developer components: you define the views. If your customers need to author their own dashboards, you either build that editor yourself on top of the components or use a BI platform that already ships one.
Ready to put analytics in your app?
Build it from components, or embed a full analytics platform.