Rich Technical Indicators
ApexStock comes with a wide range of built-in technical indicators like SMA, EMA, RSI, MACD, and more to help you analyze financial data effectively.
Interactive Drawing Tools
Draw trend lines, horizontal lines, rectangles, and other shapes directly on your chart to annotate and analyze price movements.
Multiple Chart Types
Switch between candlestick, OHLC, line, and area chart types to visualize your financial data in the way that works best for you.
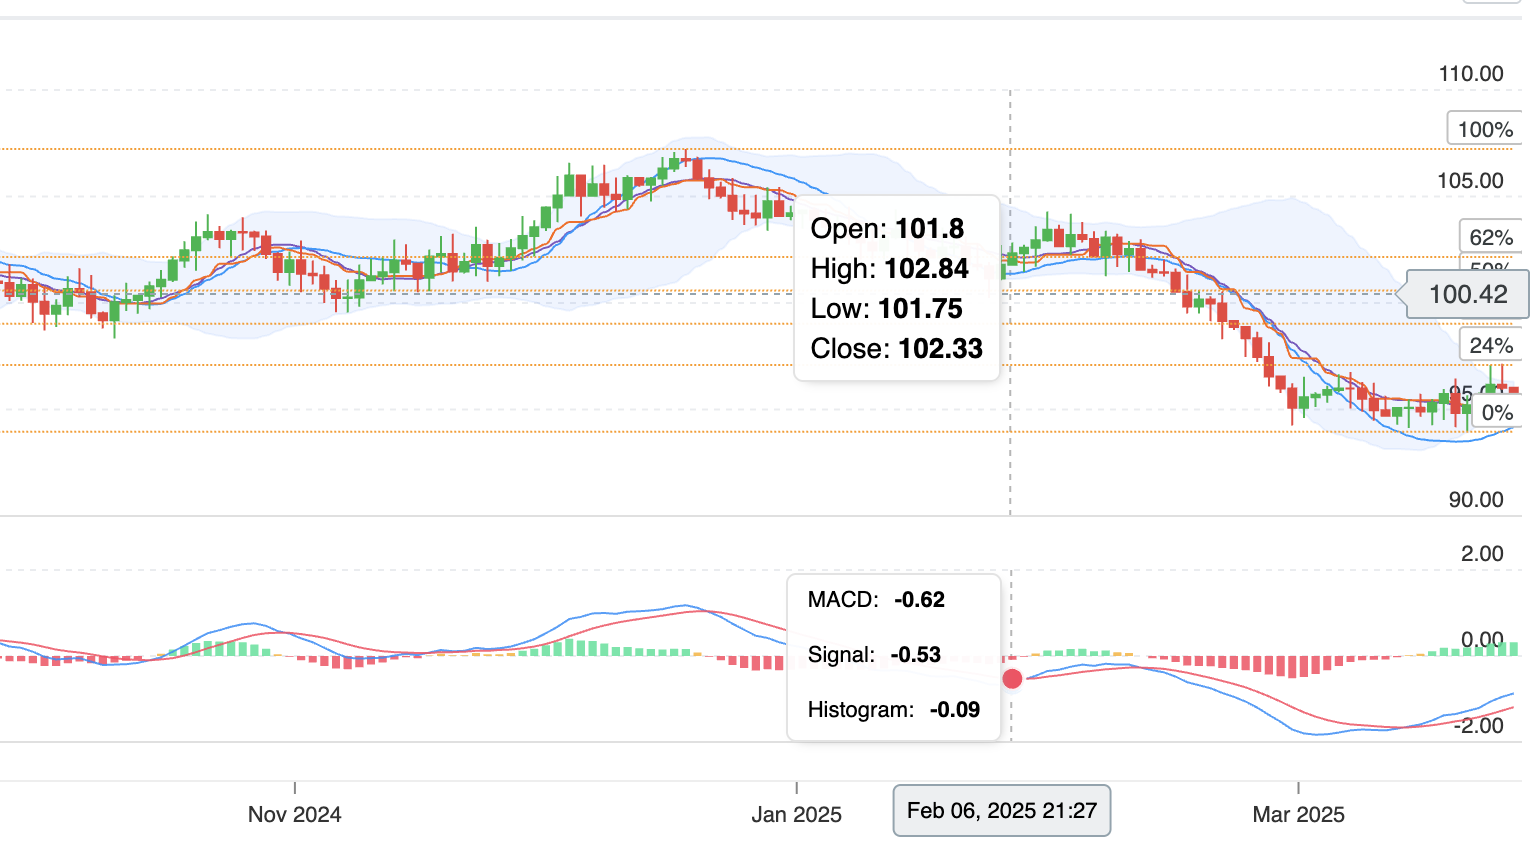
Tooltip Pinning
Pin price information tooltips directly to your chart to create persistent reference points. Pinned tooltips remain visible during chart navigation and can be positioned, moved, or deleted like other drawing elements.
Advanced Time Navigation
The responsive time axis automatically adjusts tick density and formatting based on the current zoom level, showing appropriate minute, hour, day, week, or month labels.
Smooth Navigation
Navigate large datasets effortlessly with intuitive zooming and panning controls. The responsive chart maintains high performance even with thousands of data points, allowing seamless exploration of historical data.
Chart Exporting
Capture and share your technical analysis with high-quality exports. Save charts as SVG files with all your annotations, indicators, and drawings preserved for documentation or sharing with colleagues.
Ready to enhance your financial applications?
Start building powerful stock charts with ApexStock today.
APEXSTOCK DEMOS