ApexCharts
  • Products

    ApexCharts.js
    Modern, interactive charts for the web
    ApexGrid
    High-performance data grid for the web
    ApexMaps
    Maps and geographic data visualization
    ApexGantt
    Project planning with dependencies
    ApexTree
    Org charts and hierarchical diagrams
    ApexSankey
    Flow and relationship diagrams
    ApexStock
    Financial charts and indicators
    Chart Editor
    Visual chart builder, no code required

    By capability

    • JavaScript Data Grid
    • JavaScript Gantt Chart
    • JavaScript Sankey Diagram
    • JavaScript Org Chart
    • JavaScript Stock Chart
    • JavaScript Map Chart
  • Build something

    • ShowcaseFull applications built on several Apex products at once
    • RecipesHow to solve one concrete problem, with the wiring code

    Browse examples

    • All demosEvery gallery, across all seven products
    • Chart featuresWhat the charting library can do
    • Unit shapesPictorial charts drawn from real shapes
  • Docs
  • AI
  • Pricing
  • Learn

    • BlogReleases, research and engineering notes
    • What's newThe current version of every product, and its release notes
    • Loved by developersWhat people build and say
    • Embedded analyticsDashboards and reporting inside your product

    Company

    • SupportGet help from the team
    • LicensingWhat each plan permits
    • About us
  • The chart
  • Basic Stock Chart
  • Time-frame Aggregation
  • Price Scale Modes
  • Large Dataset
  • Realtime Streaming
  • Analysis
  • Range Analysis
  • Comparison Mode
  • Cross-Chart Sync
  • Drawing & annotation
  • Trading Overlays
  • Event Markers
  • Data Legend
  • Chrome, theming & export
  • Toolbar Customization
  • Custom Theming
  • Export

ApexStock Demos

Browse all ApexStock sample demos. Click any thumbnail to see the live demo and source code.

FRAMEWORKS
Angular React Vue

The chart

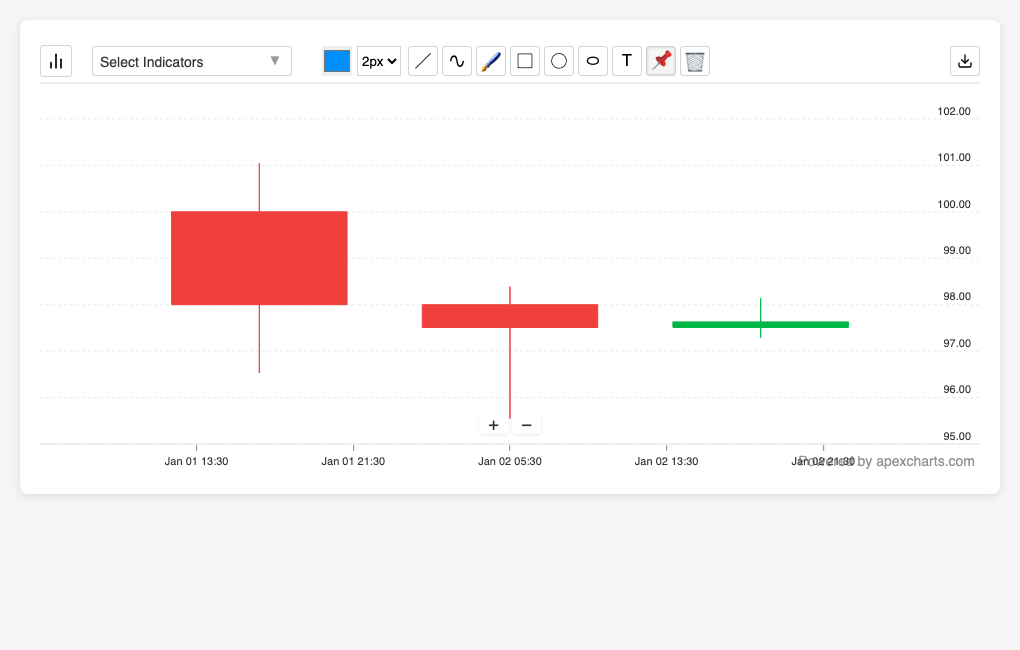
Basic Stock Chart
Basic Stock Chart
OHLC data in, a candlestick chart with a toolbar and indicators out.
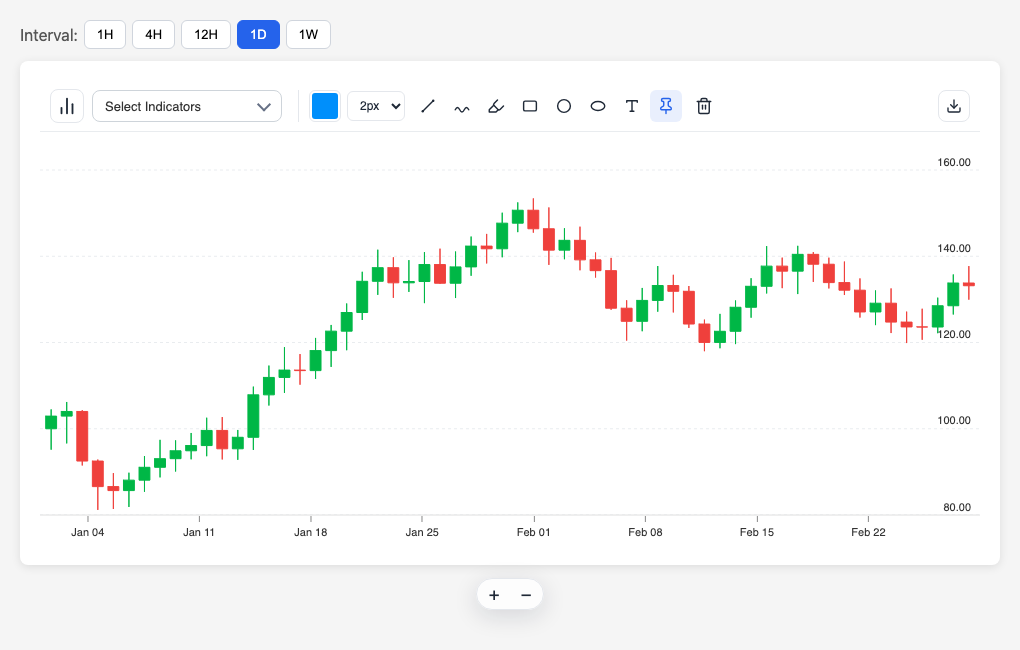
Time-frame Aggregation
Range and interval are independent: setVisibleRange for the window, aggregateOHLC for the bar size.
Price Scale Modes
Price Scale Modes
Linear, logarithmic, percent-change and indexed axes. Only log changes the gridline distribution.
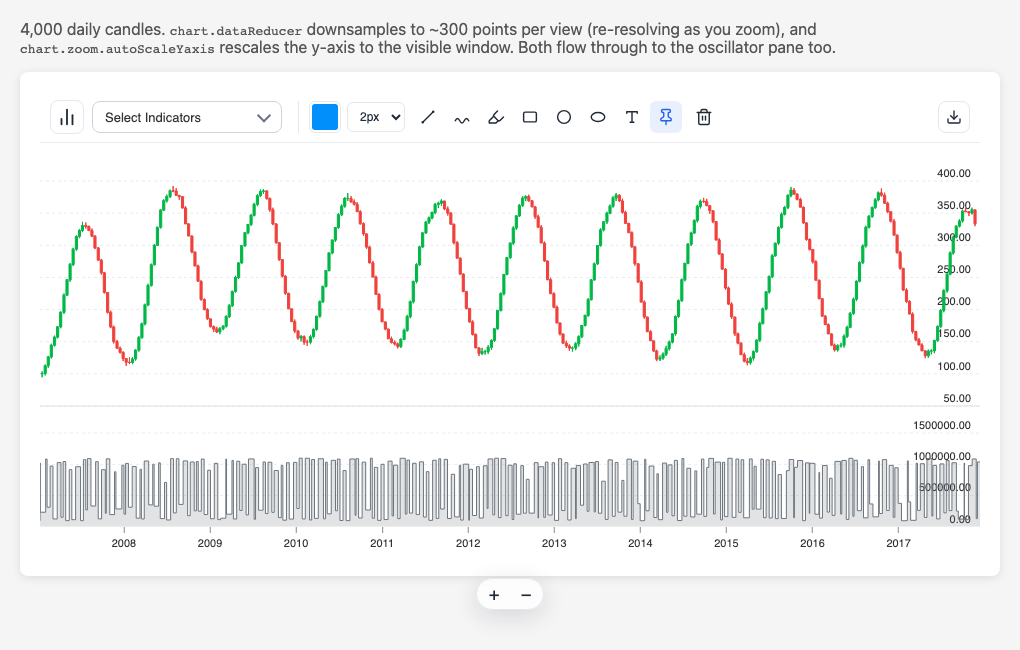
Large Dataset
Large Dataset
Thousands of bars, zoomed and panned, with the indicators recomputing.
Realtime Streaming
Realtime Streaming
appendData on a live feed, with the indicators stepping incrementally rather than recomputing.

Analysis

Range Analysis
Range Analysis
measureRange reports change, volatility and the deepest drawdown over the bars it spans, with an on-chart panel.
Comparison Mode
Comparison Mode
Several instruments aligned onto one x grid, rebased, and ranked against a benchmark.
Cross-Chart Sync
Cross-Chart Sync
ApexStock.sync mirrors the visible range and the crosshair across independent instances.

Drawing & annotation

Trading Overlays
Trading Overlays
Draggable price lines for entry, stop and target, with cross and move callbacks.
Event Markers
Event Markers
Earnings, dividends and splits flagged along the x-axis, reprojected through zoom and pan.
Data Legend
Data Legend
An on-chart OHLC readout that tracks the crosshair and stays in sync as indicators toggle.

Chrome, theming & export

Toolbar Customization
Hide built-in toolbar sections and inject your own buttons, placed and ordered.
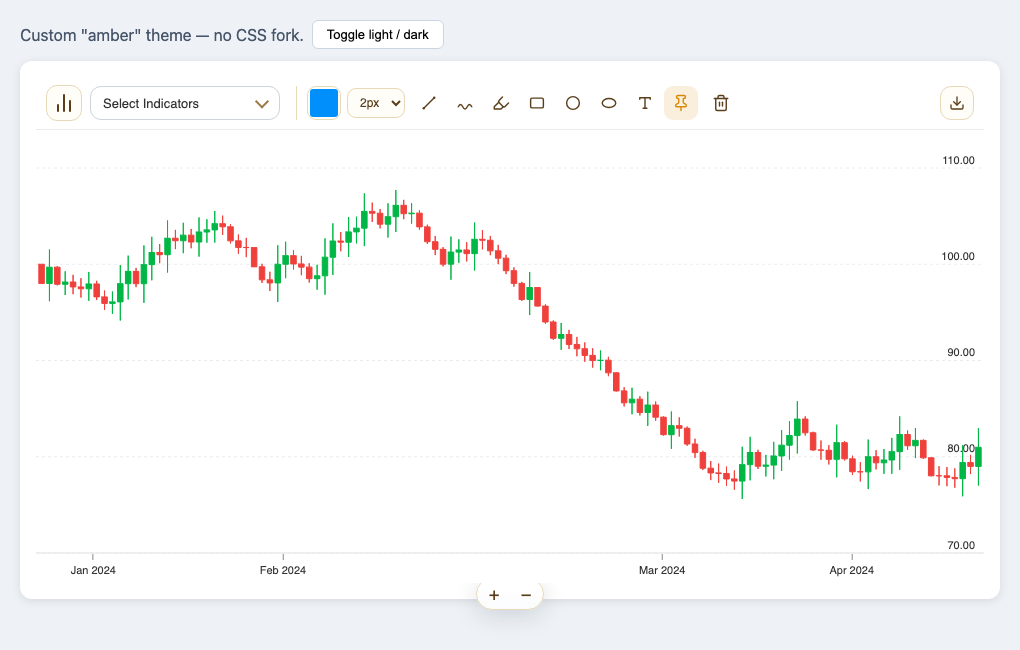
Custom Theming
Custom Theming
Light and dark modes, the named preset pack, and CSS token overrides on one chart.
Export
Export
One export() call over PNG, SVG, PDF, CSV and JSON, and what each format carries.