Drill down from a chart into a grid
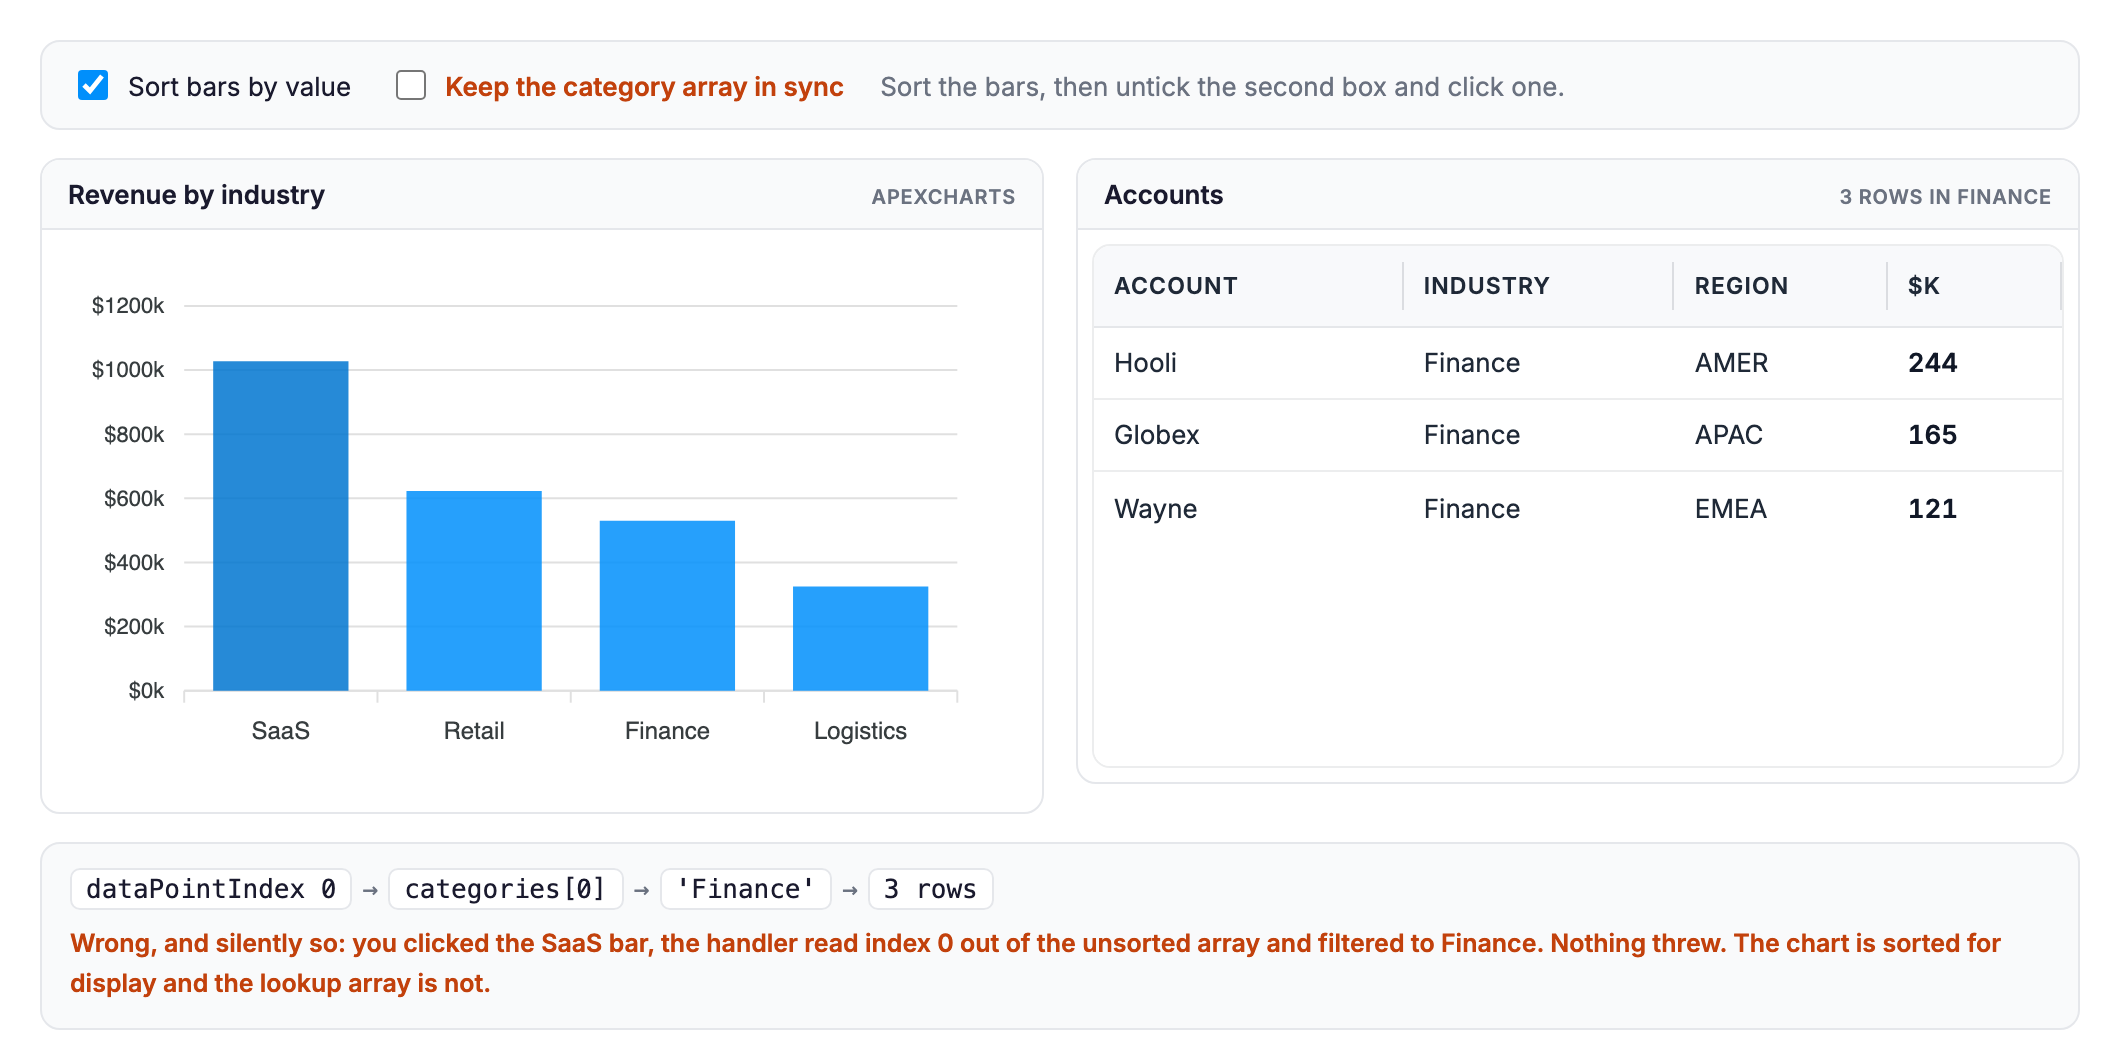
Click a chart bar and filter a data grid to it: the dataPointSelection payload, mapping an index to a value, and the re-render ordering that breaks first.
- Charts
- Grid
 Charts
 Grid
Grid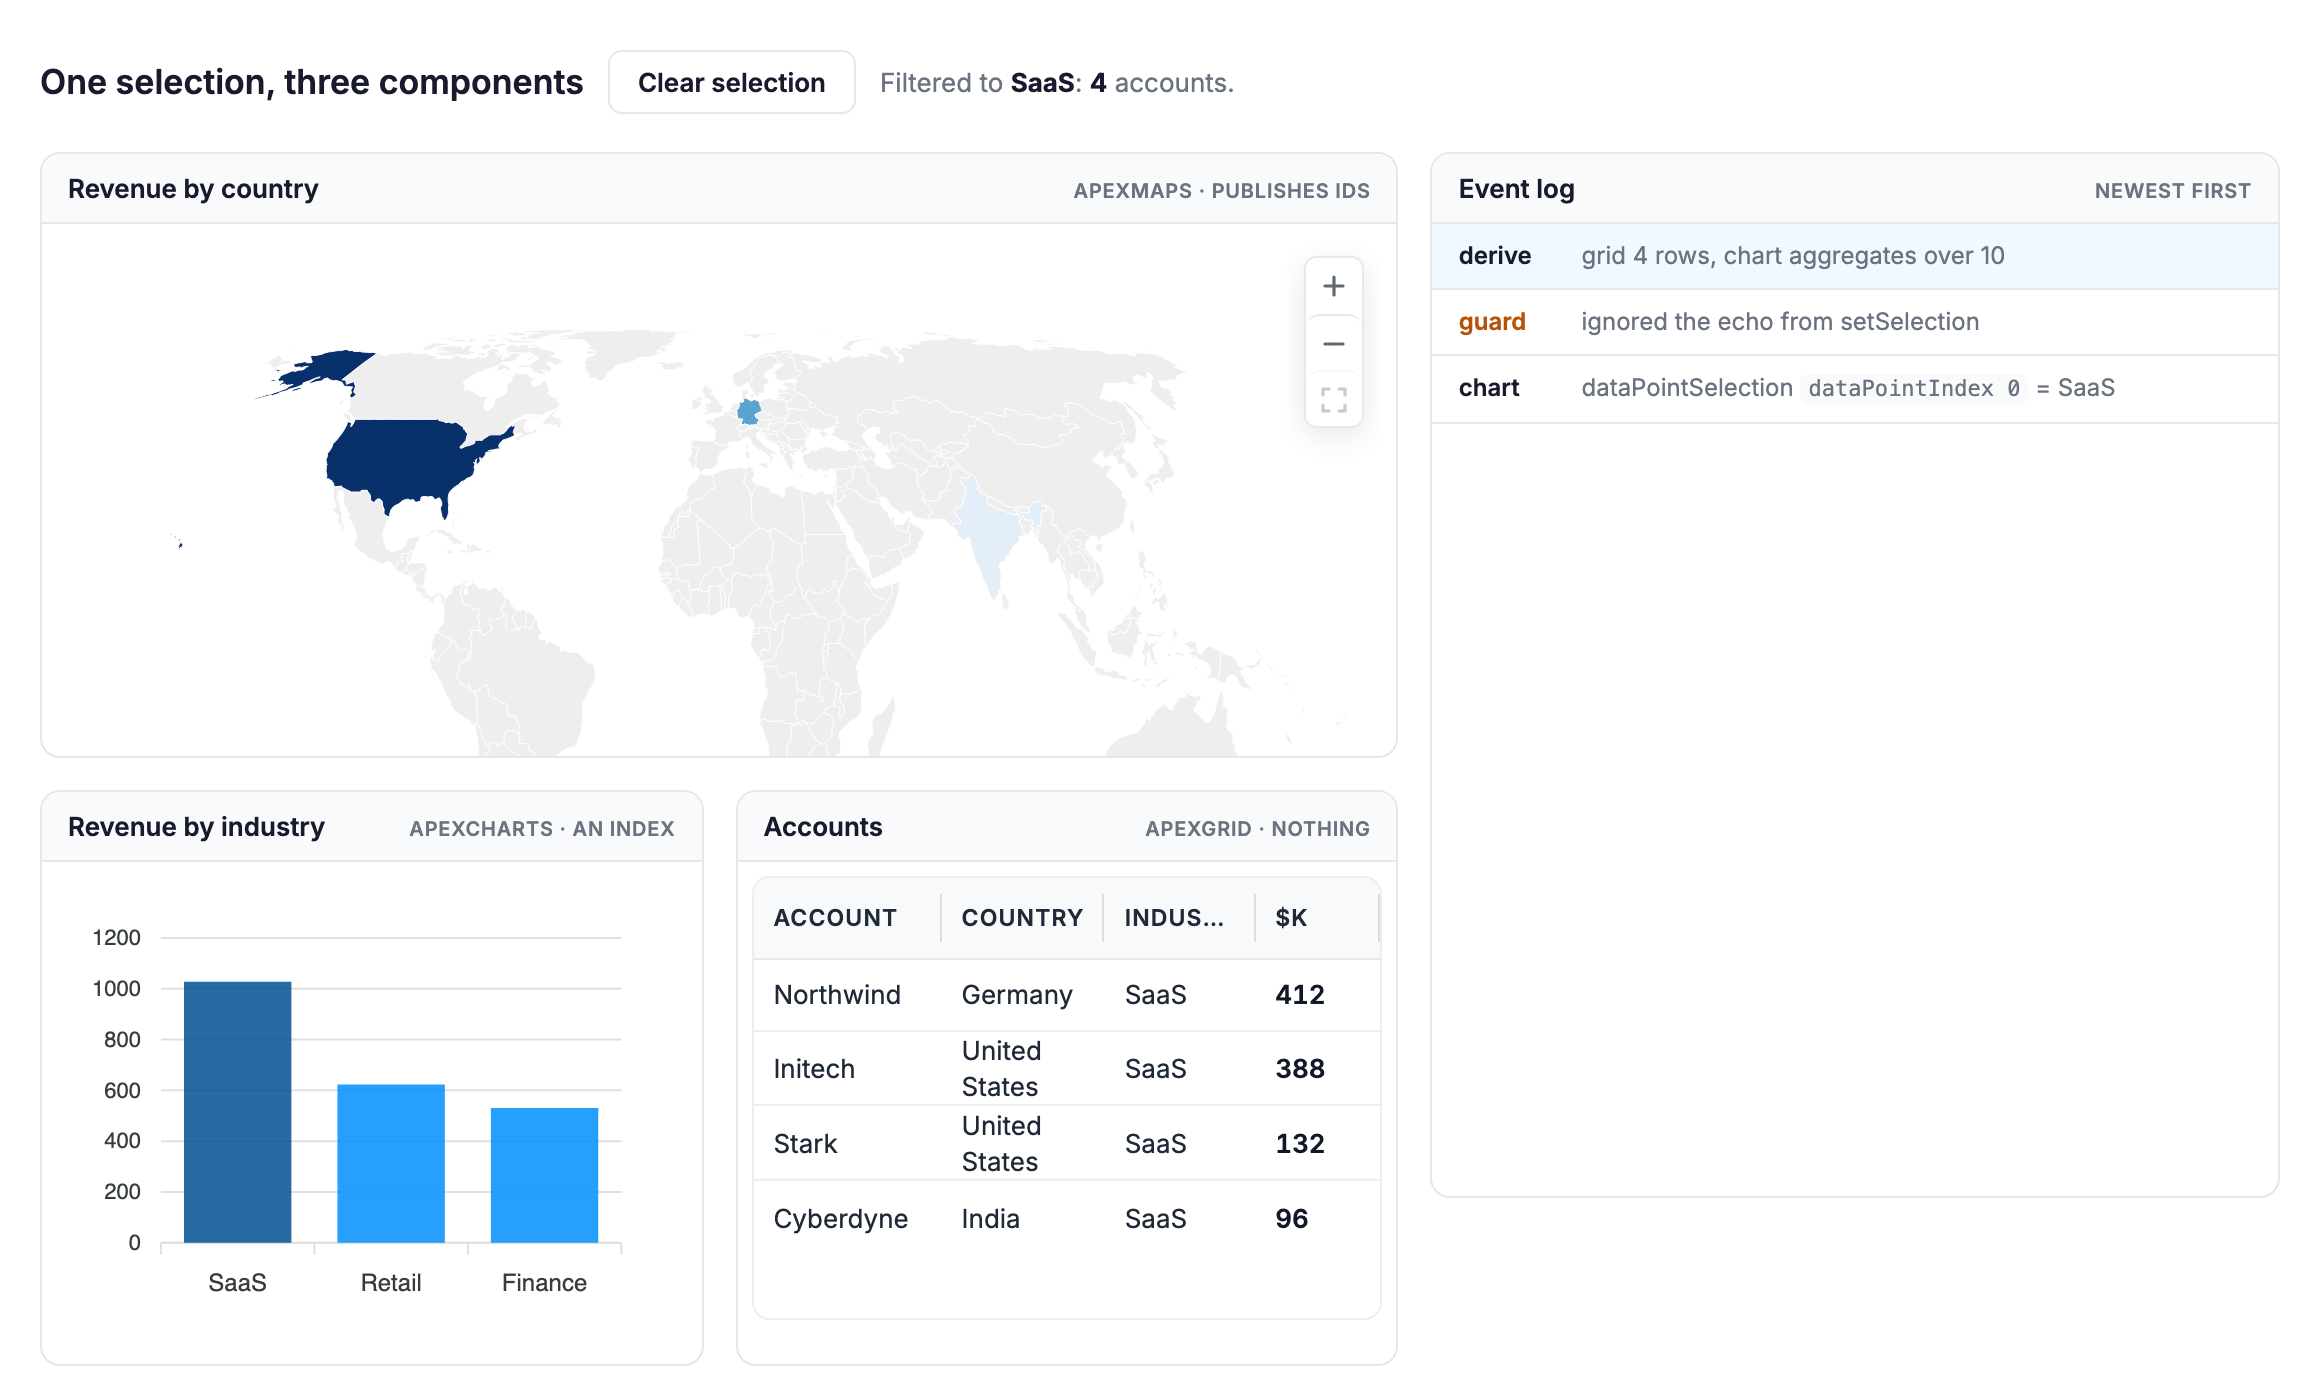
Sync a map selection to a chart and a grid
Click a map region and filter a chart and a data grid to it: the shared-store contract, the re-entrancy guard, and what ping-pongs without one.
- Maps
- Charts
- Grid
 Maps
Maps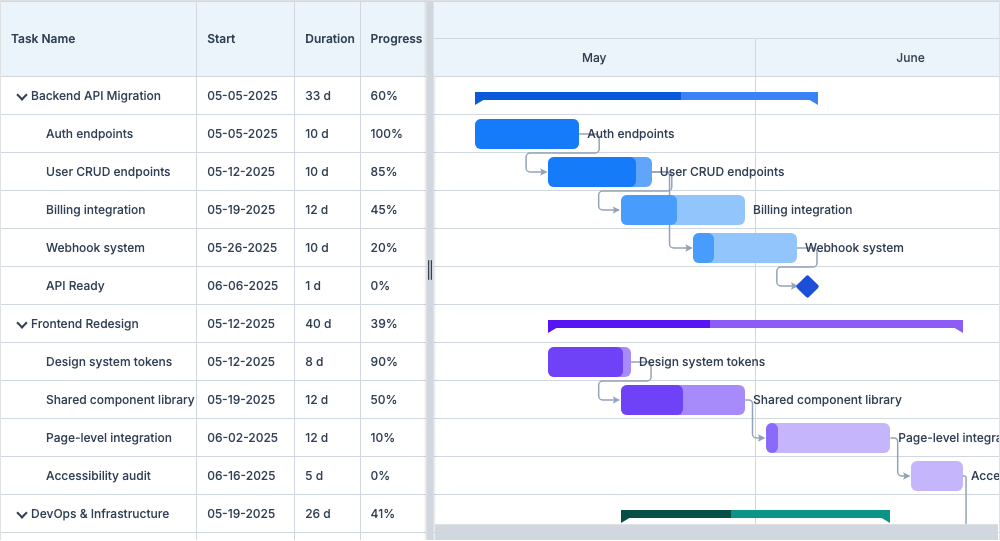
Build a project timeline from a task list
Turn task rows into an ApexGantt timeline by mapping field names instead of transforming data, and avoid the date format that shifts a plan by months.
- Gantt
 Gantt
Gantt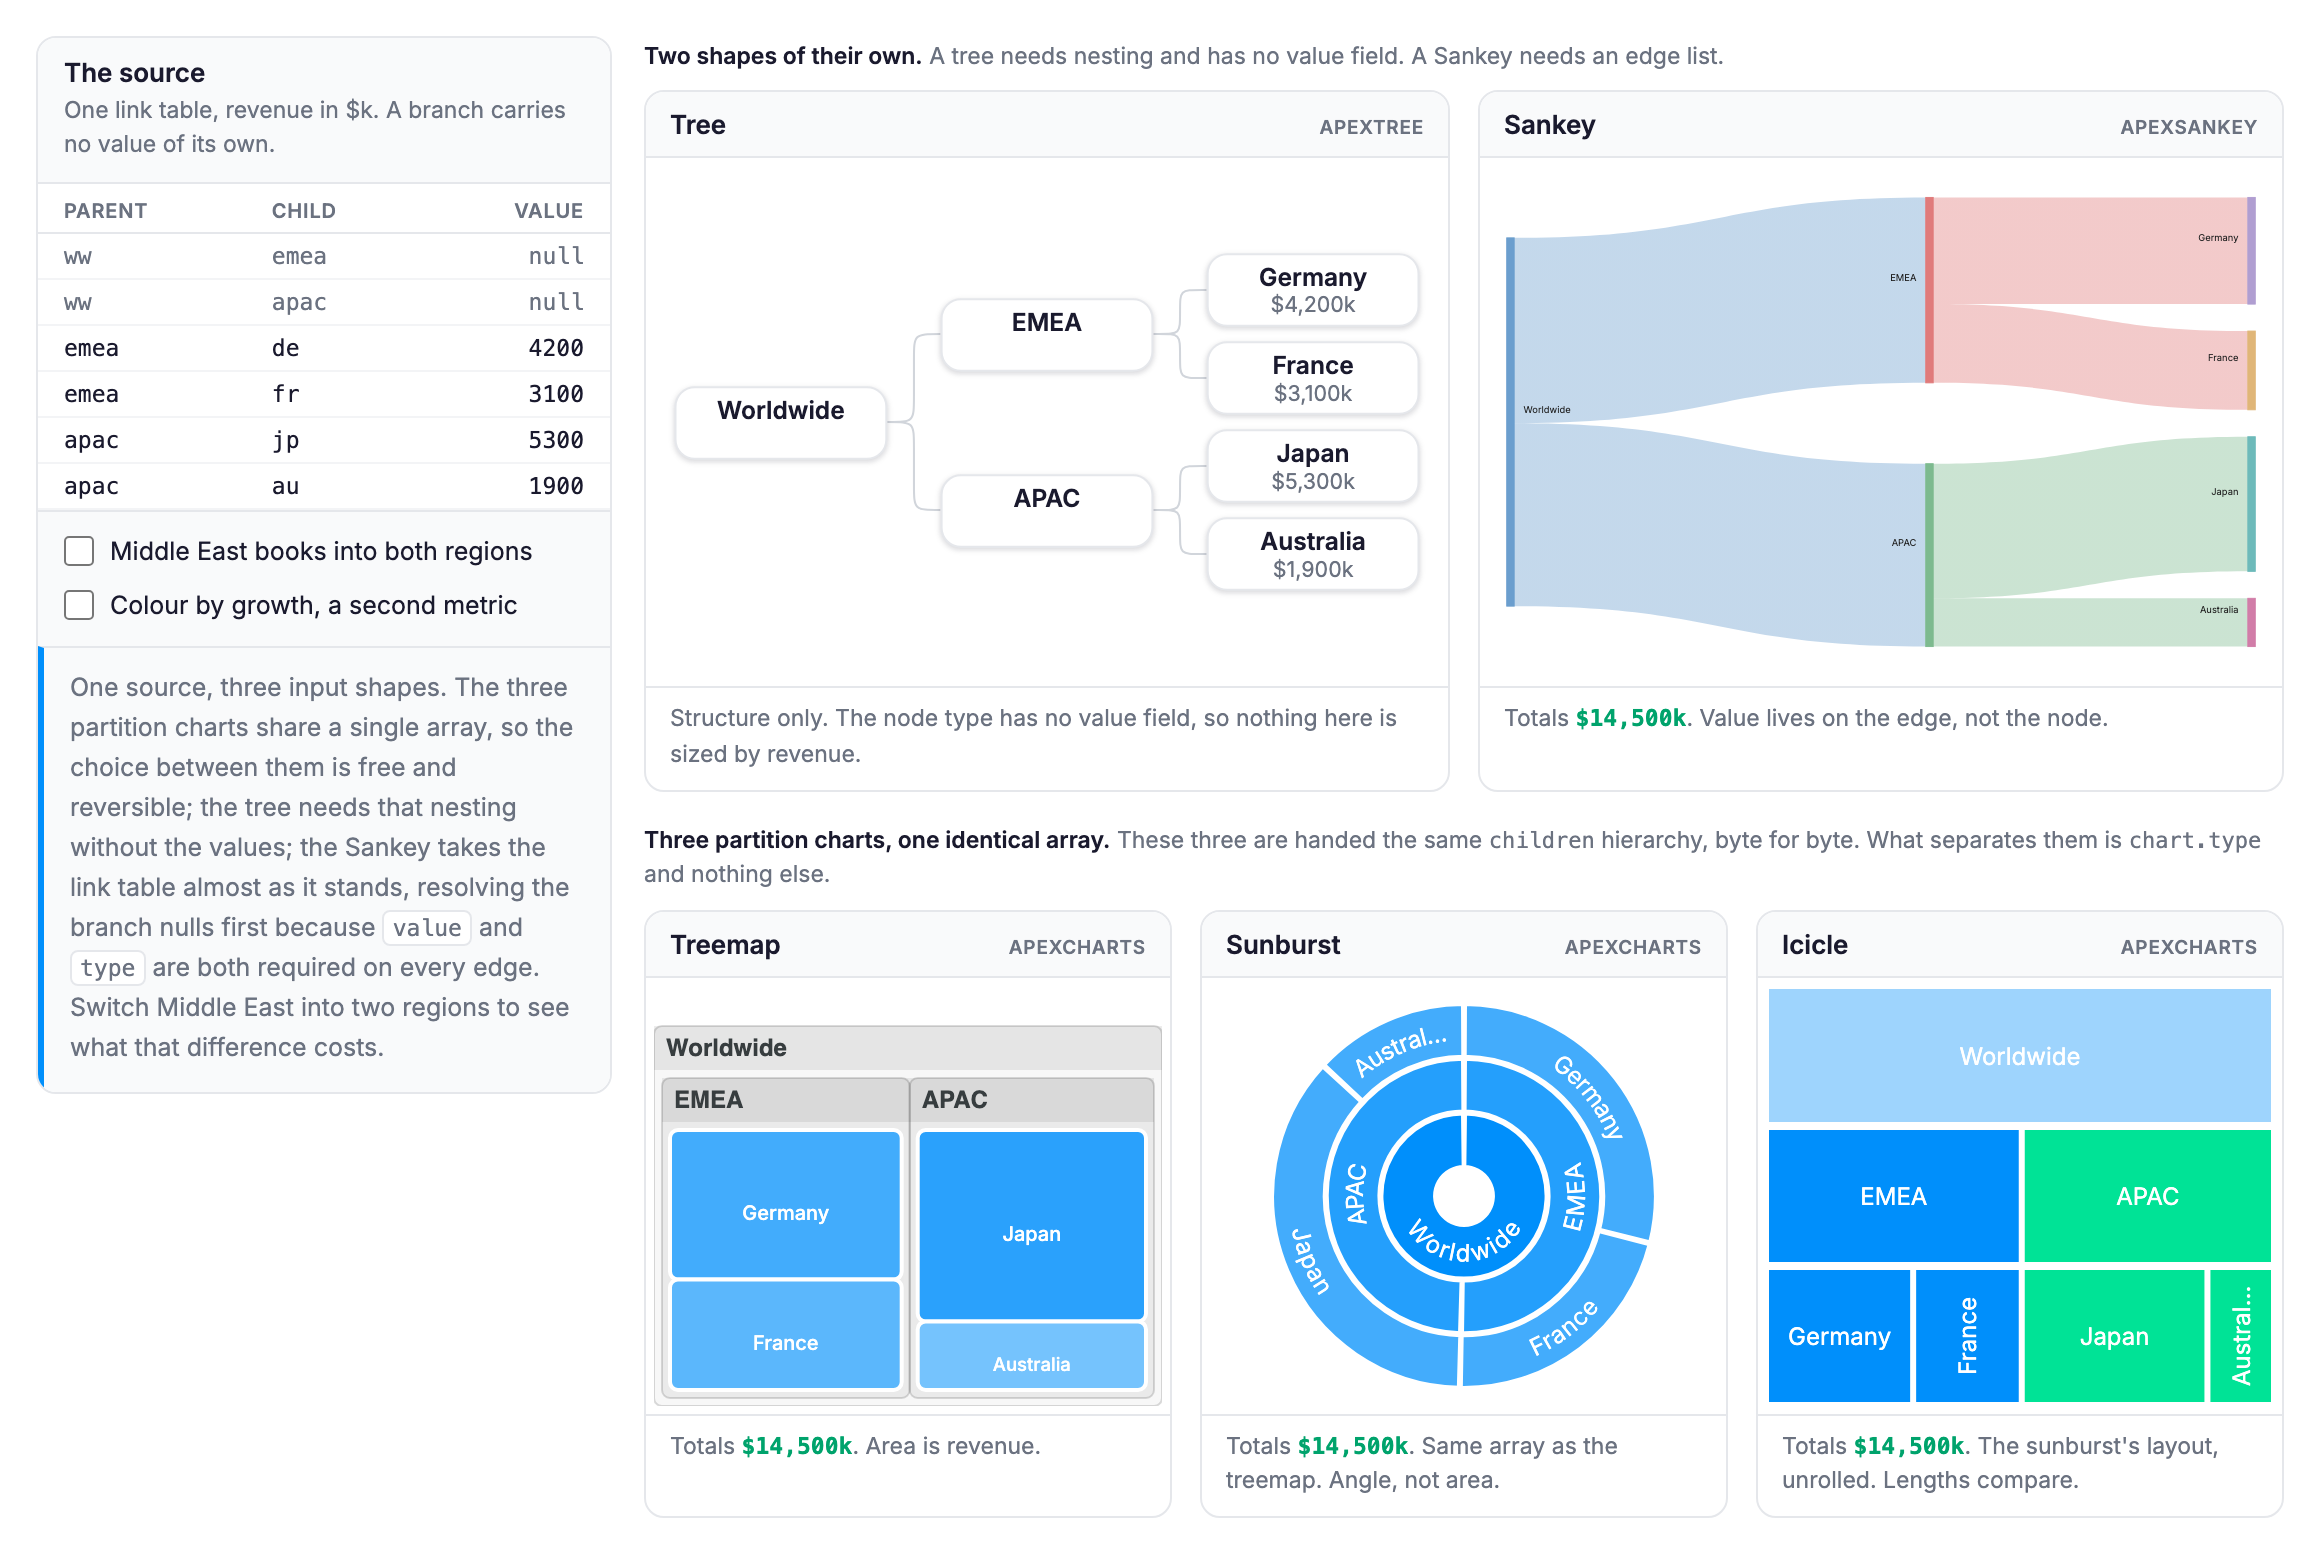
Choosing a visualization for hierarchical data
Five renderers for hierarchical data, chosen by the shape your data has: which need nesting, which needs an edge list, and which can encode a second metric.
- Charts
- Tree
- Sankey
 Tree
Tree Sankey
Stream live market data into a stock chart
Append ticks to a live candlestick chart without rebuilding it: the forming-bar flag, the rolling window, which indicators stream, and the teardown that leaks.
- Stock
- Charts
 Stock
Stock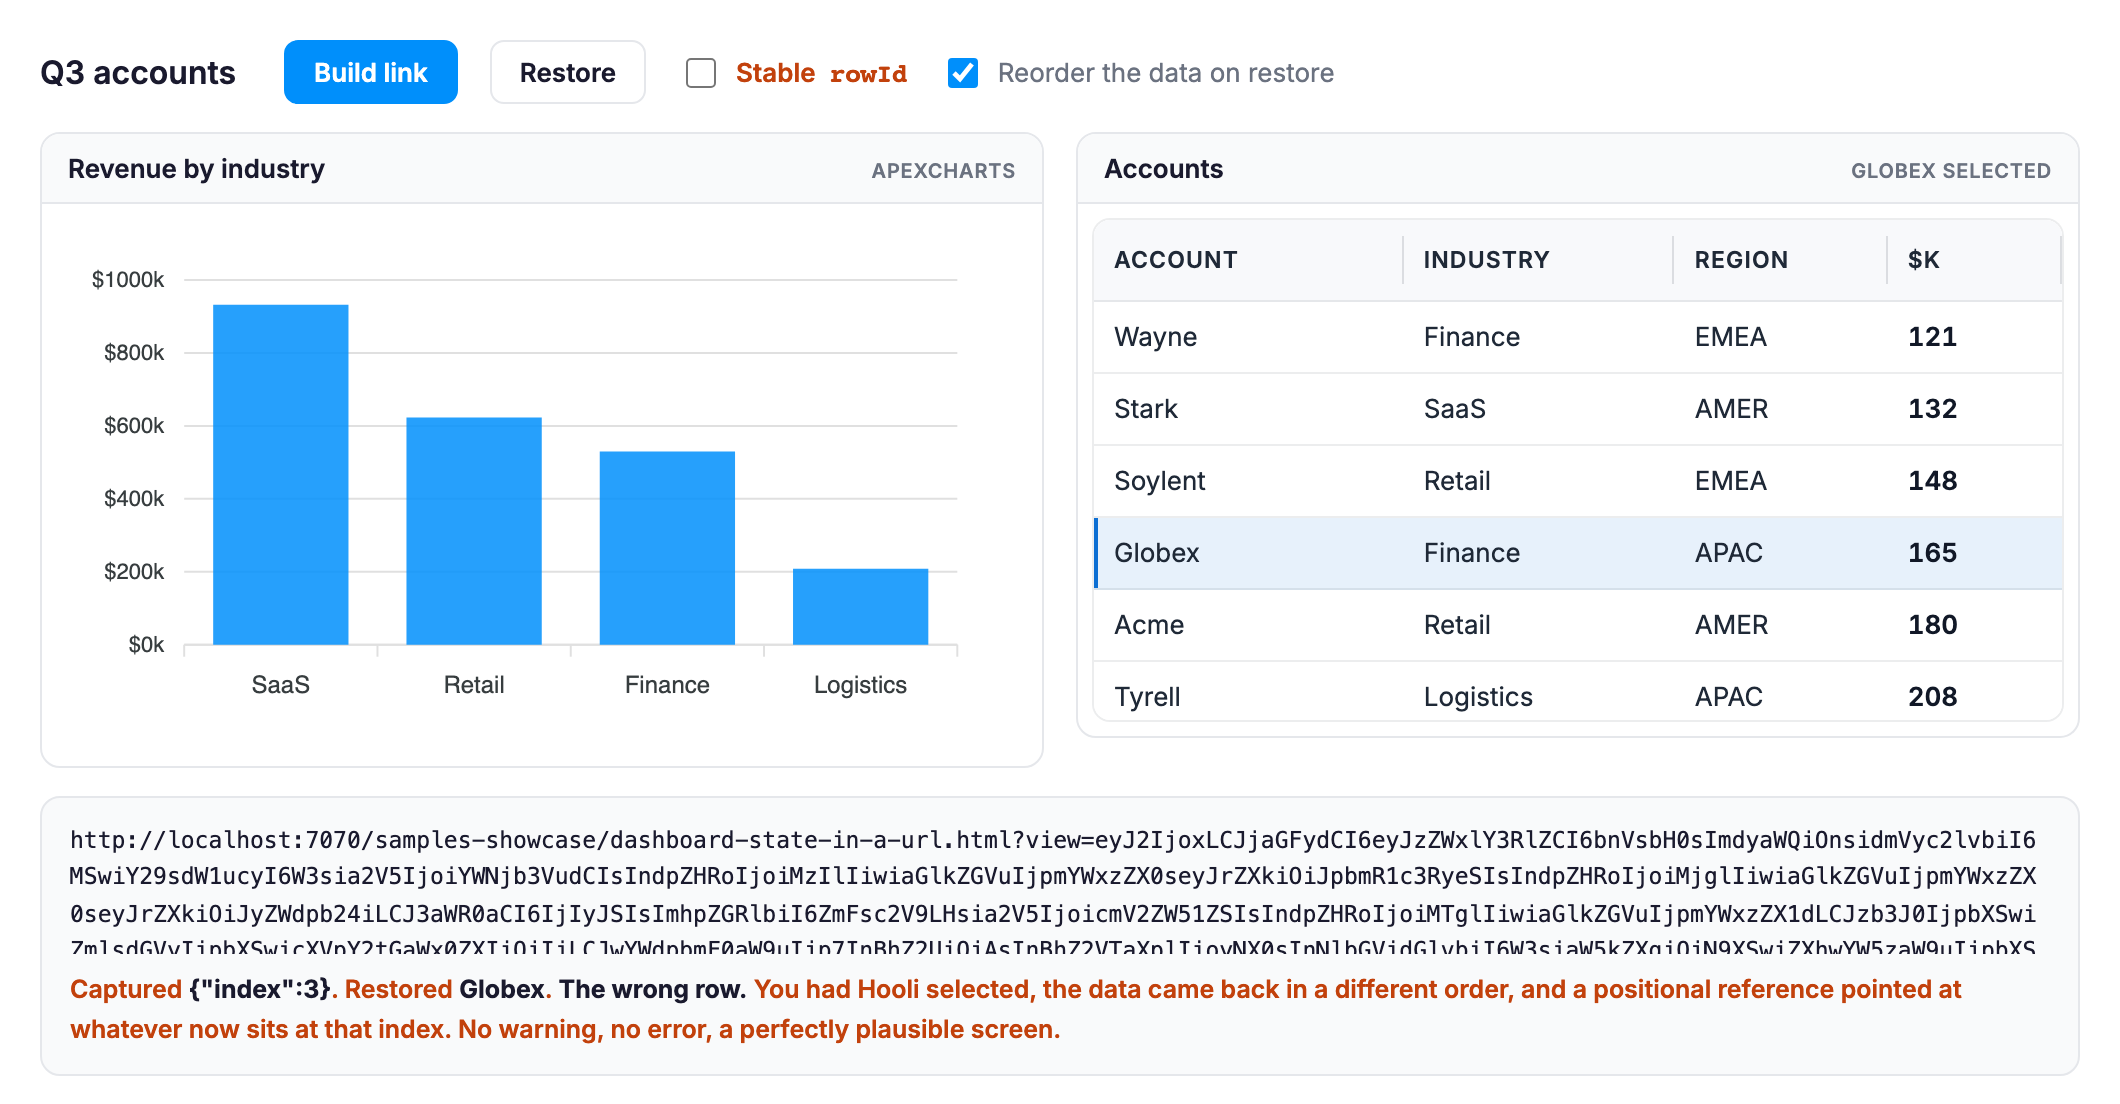
Put a dashboard's view state in one URL
Put filter, zoom and selection from four products in one shareable link: what belongs in a URL, how to shrink the token, and the restore that picks a wrong row.
- Charts
- Grid
- Gantt
- Stock
Export a multi-product dashboard to one PDF
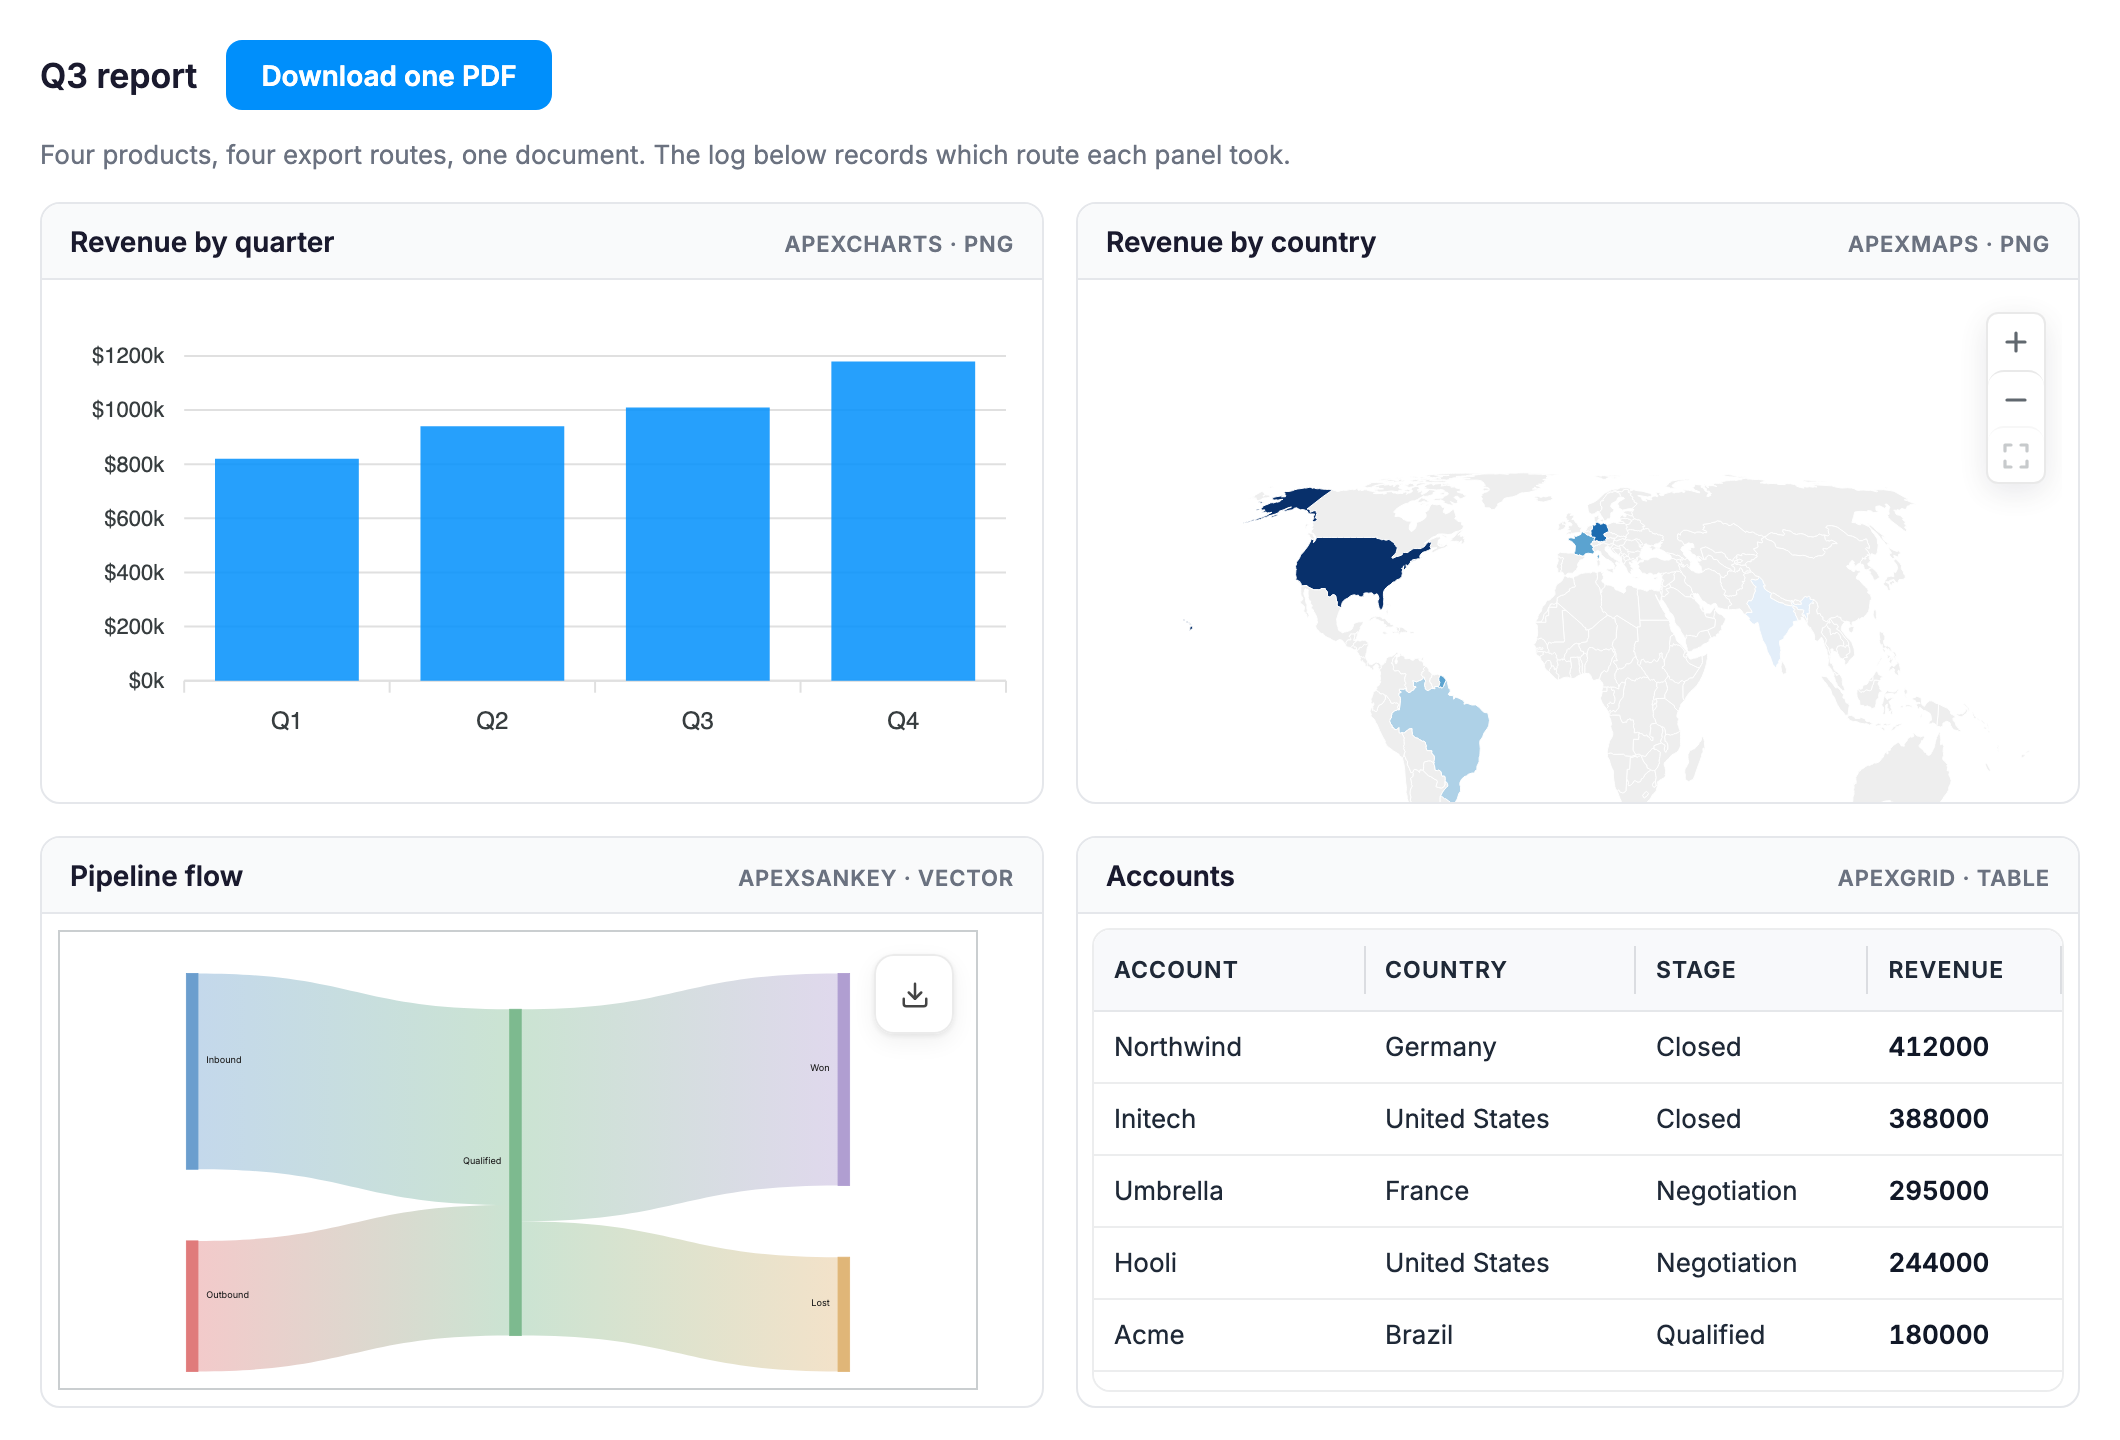
Collect every panel of a dashboard into one document: which products return an image, which only download, and why a grid belongs in a PDF as a table.
- Charts
- Grid
- Maps
- Sankey
Drill from an org chart into a people grid
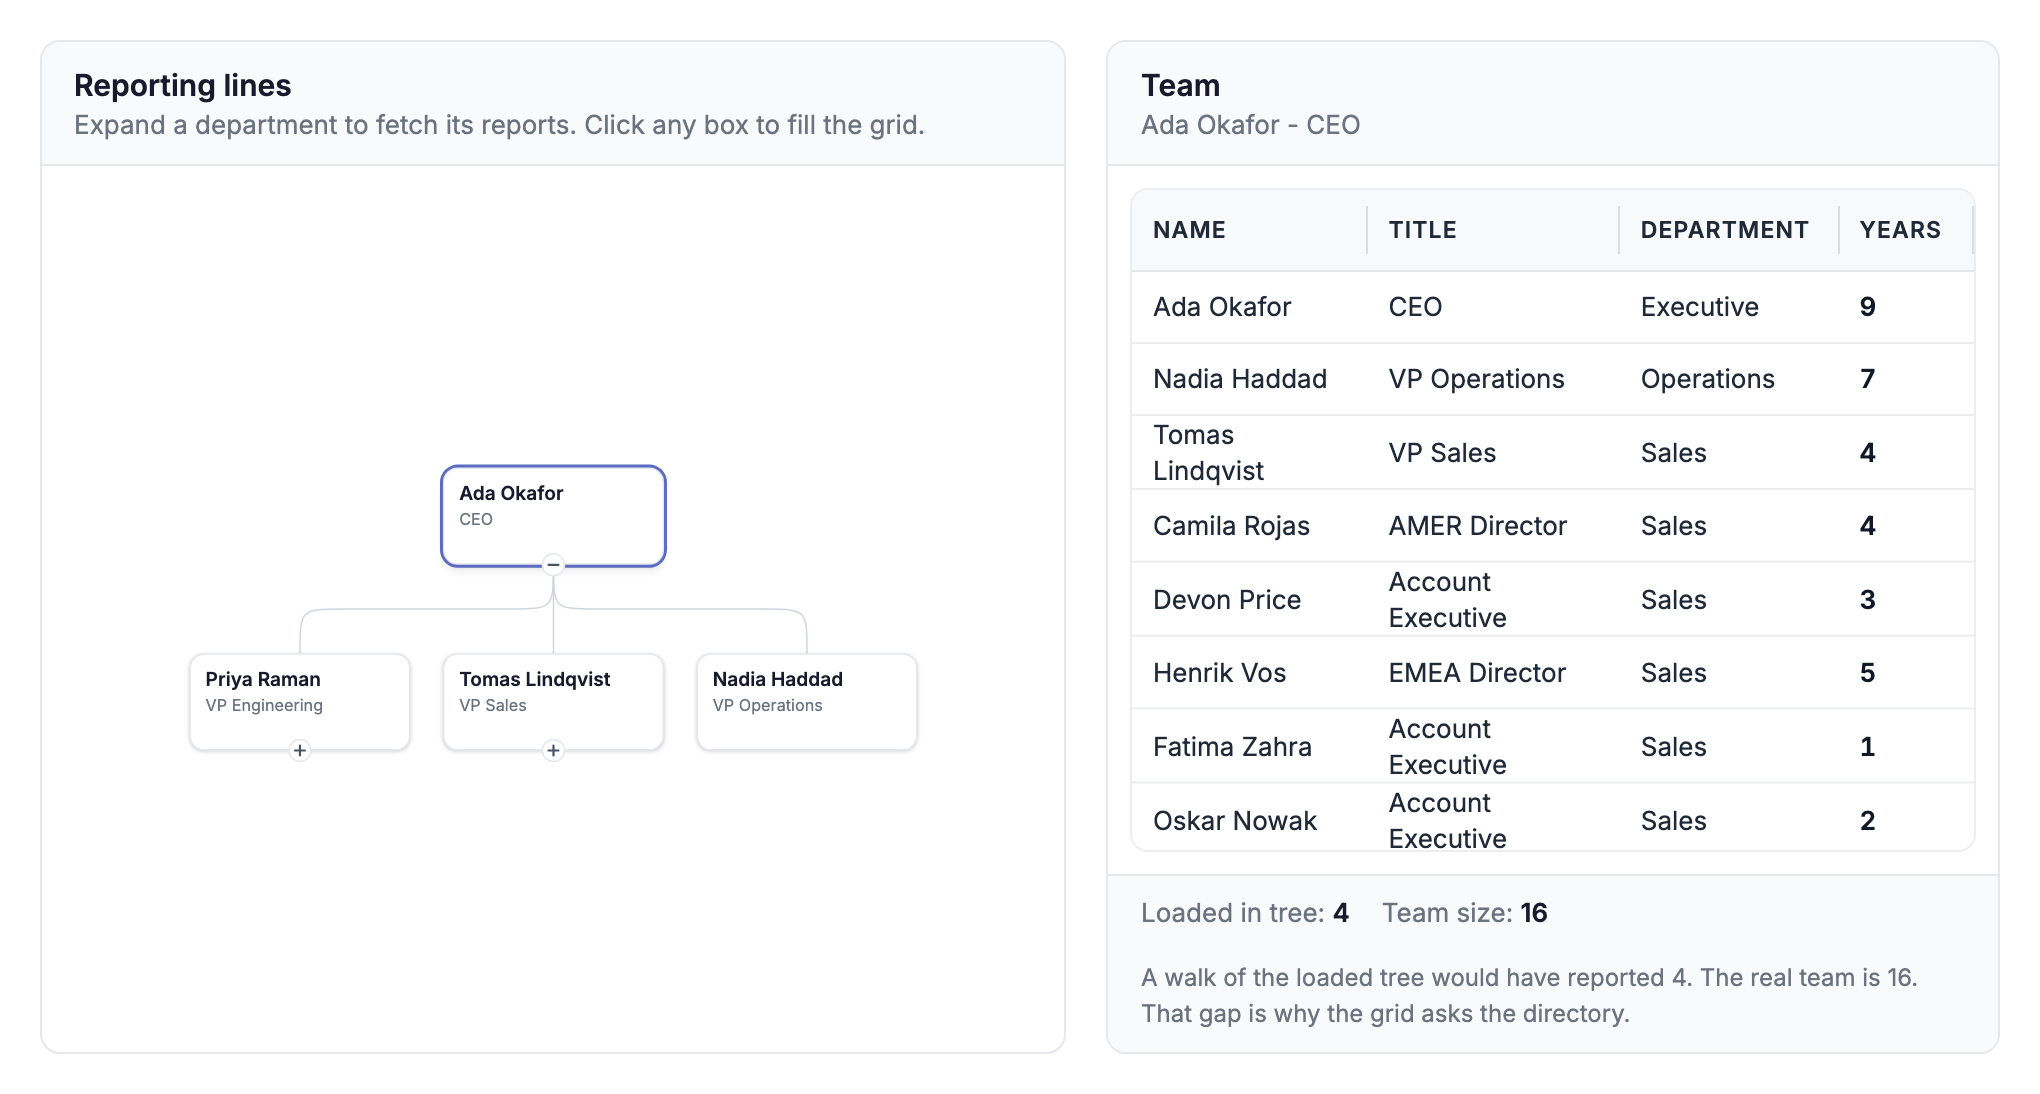
Click a manager to fill a grid with their team when the tree loads lazily: what the grid may show, the ids the tree accepts, and a count that is silently wrong.
- Tree
- Grid
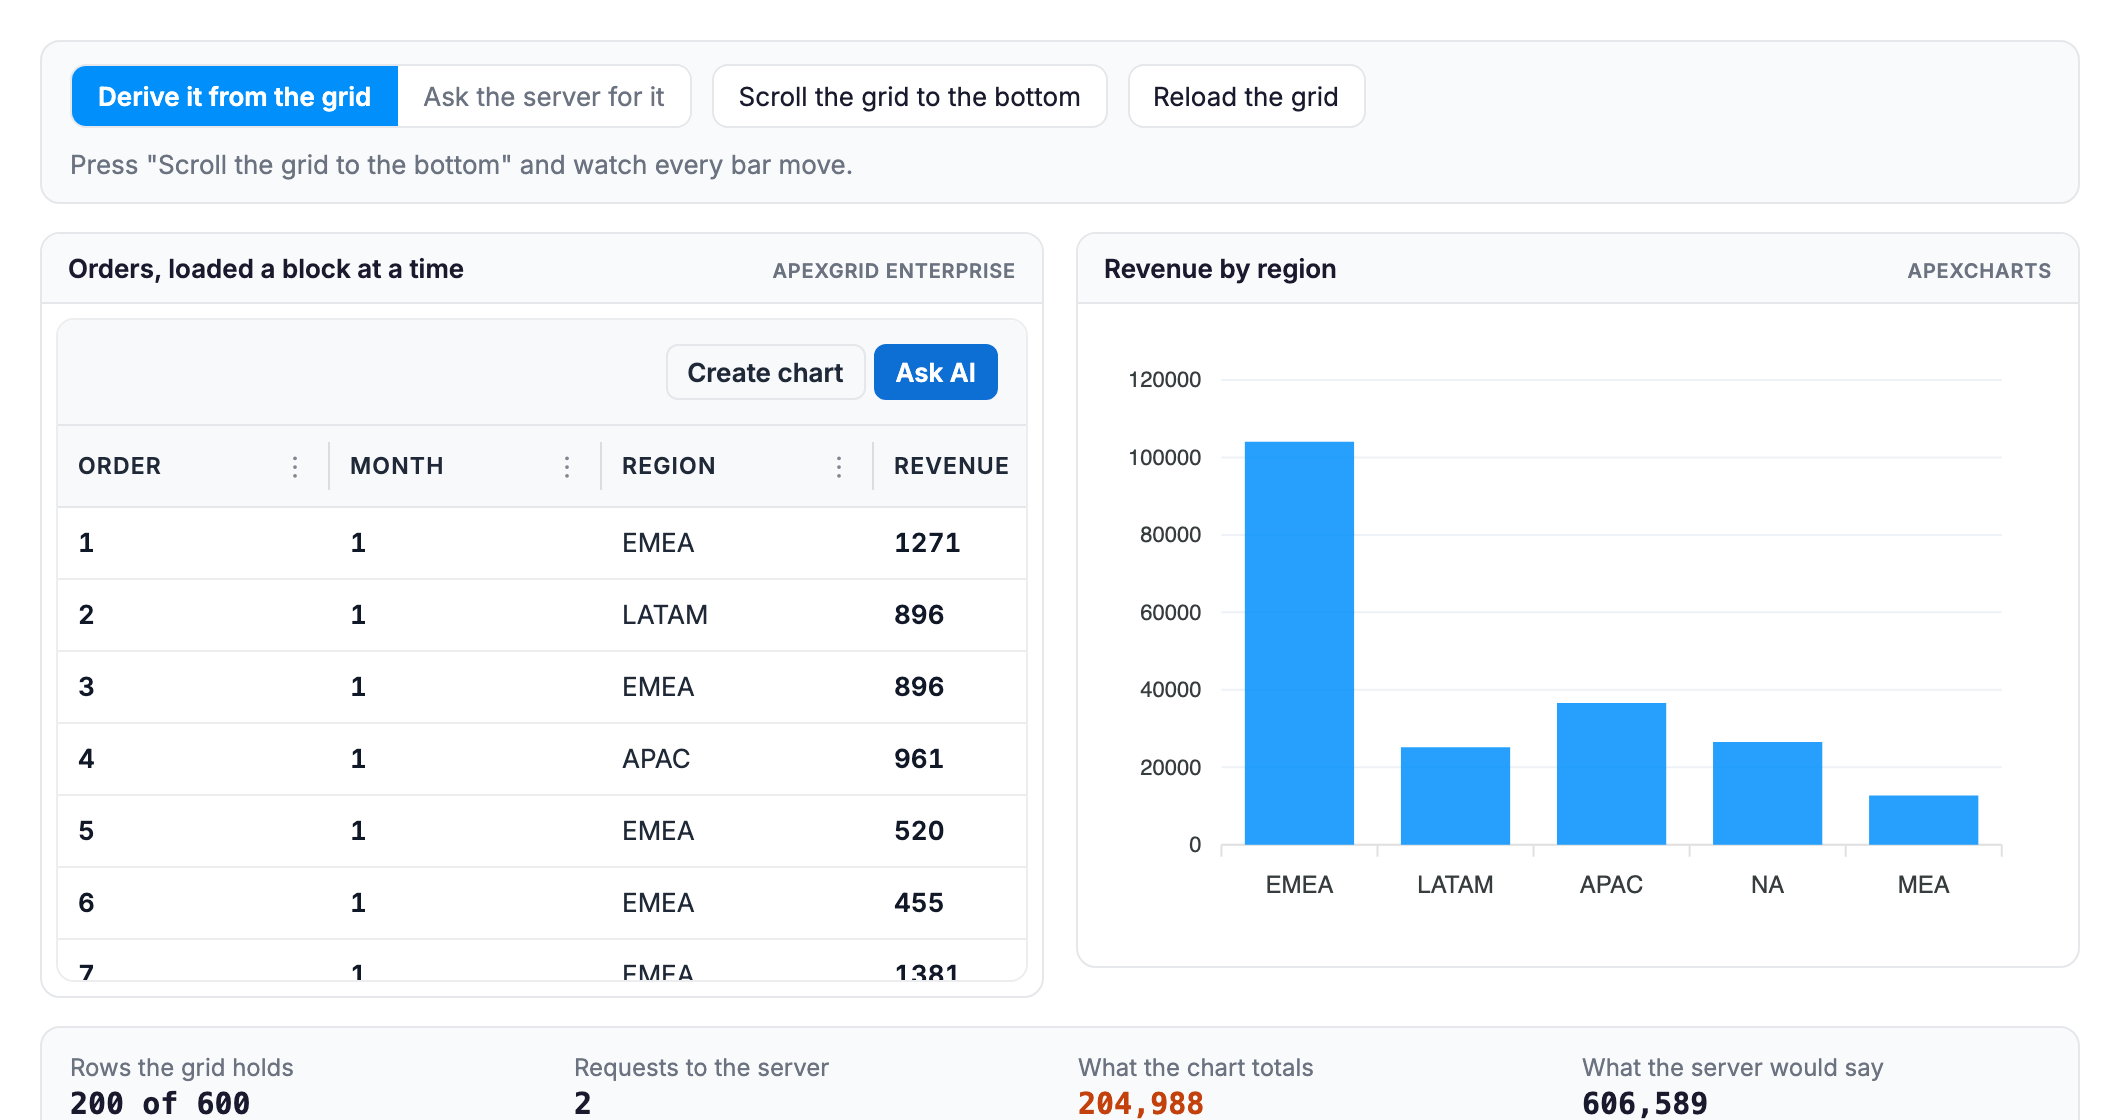
Keep a chart honest when the grid pages server-side
A chart fed from a server-paged grid totals only the blocks that are loaded. Make the grid's own request the aggregate request instead, with measured numbers.
- Grid
- Charts
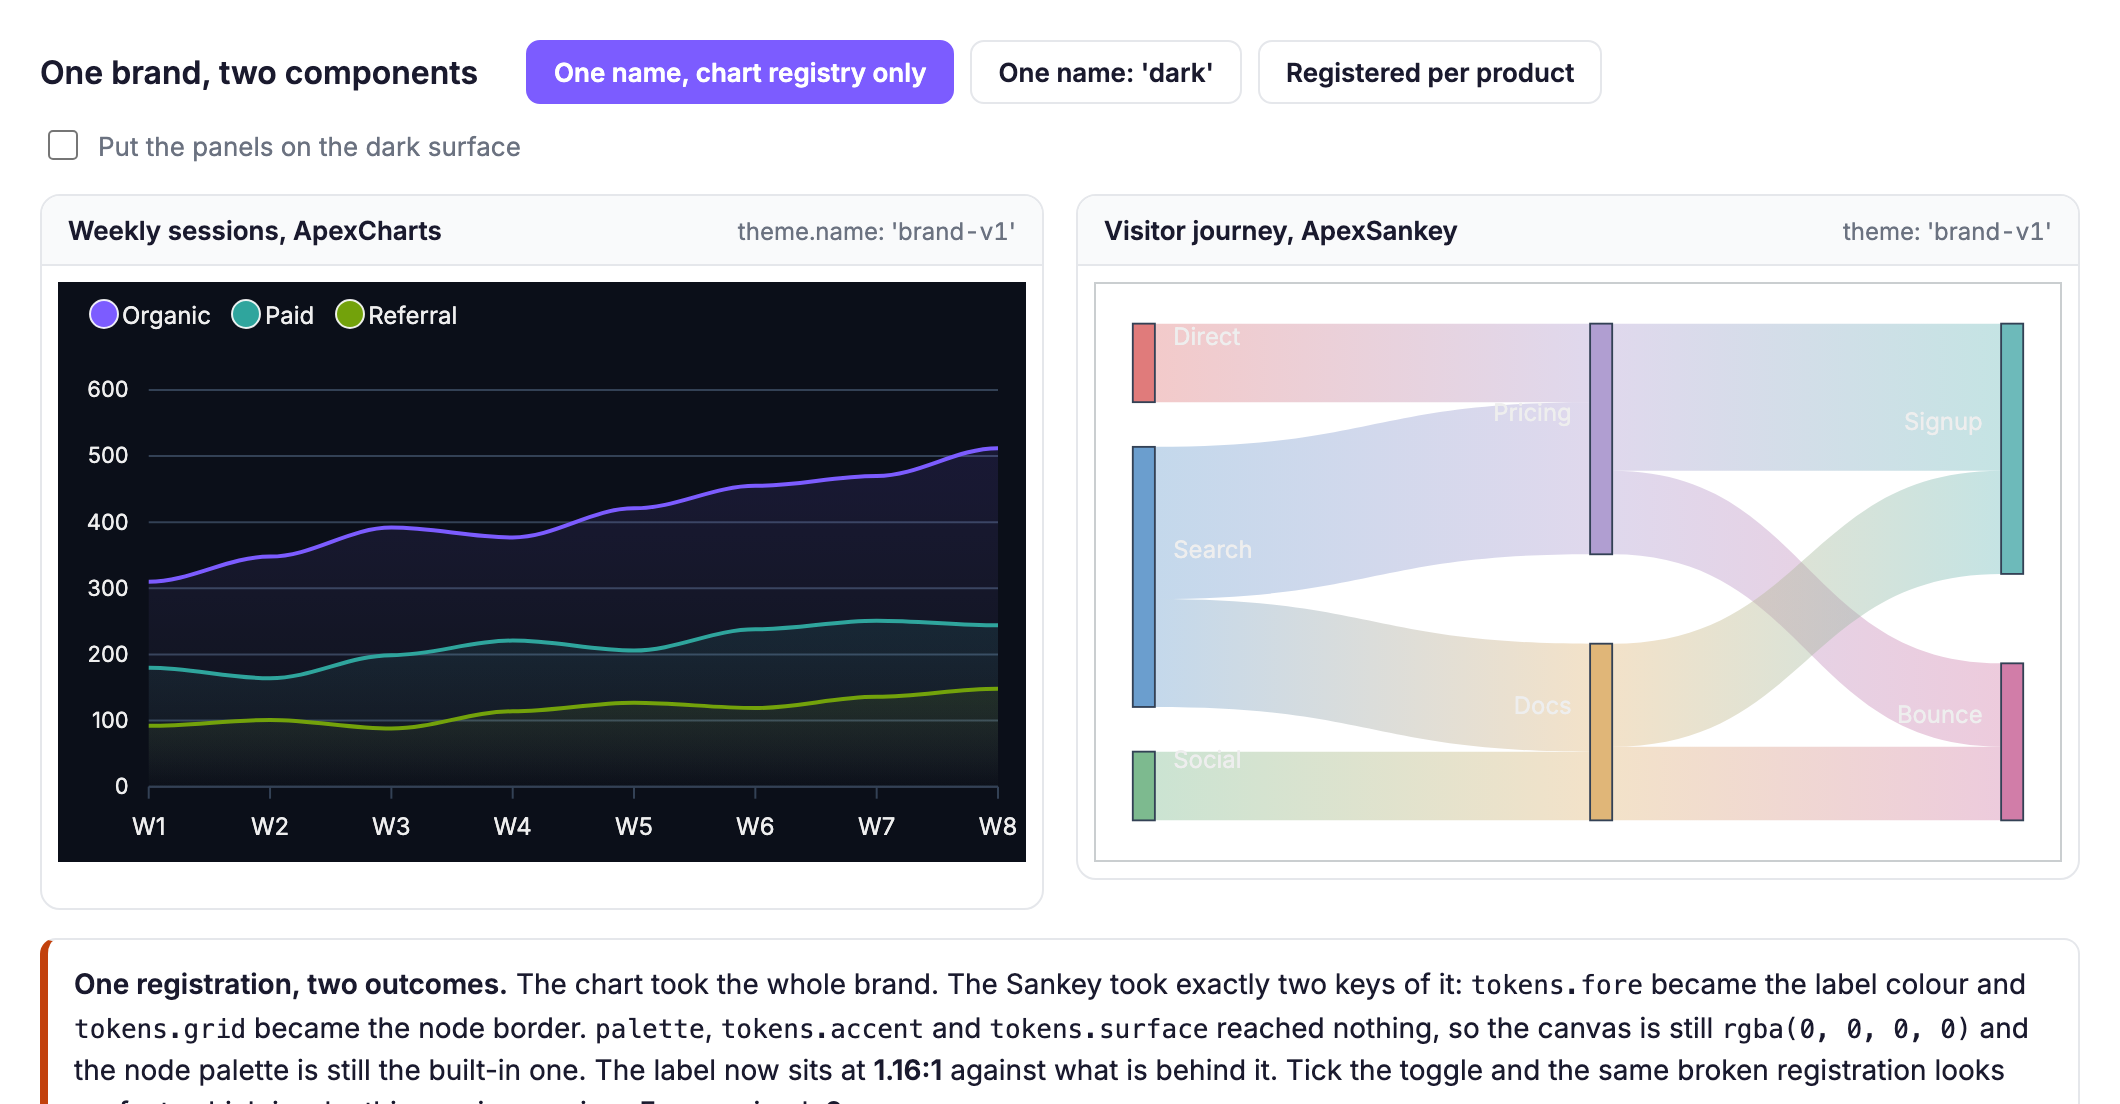
Register a brand theme across Apex products
Theme registration is per product: ApexCharts, ApexSankey and ApexStock each expose their own registerTheme, and one name passed to all of them half-works.
- Charts
- Sankey
- Stock
- Grid
Mount a chart, a grid and a map in the Next.js App Router
Mounting a chart, a grid and a map in one Next.js App Router page: which one server-renders, why the grid goes missing, and the two shapes that work.
- Charts
- Grid
- Maps