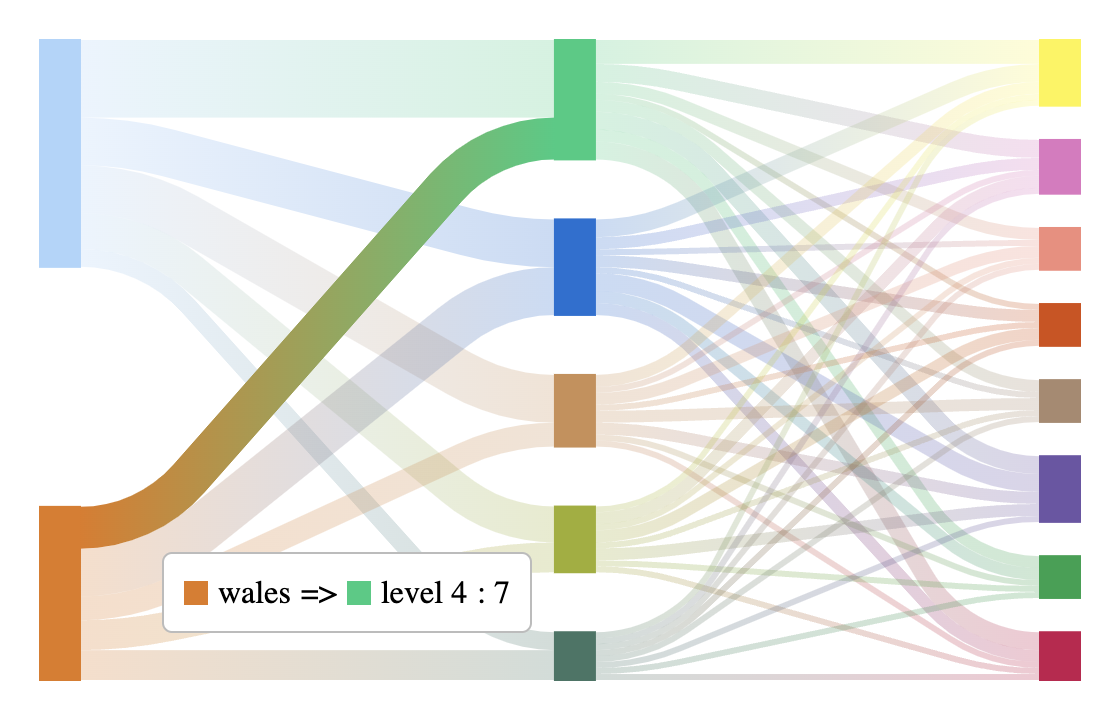
Improve user engagement with interactive link highlighting, allowing users to hover over any link to see detailed data.
This feature makes it easier to understand the relationships between nodes by clearly showing the connections and their associated values.
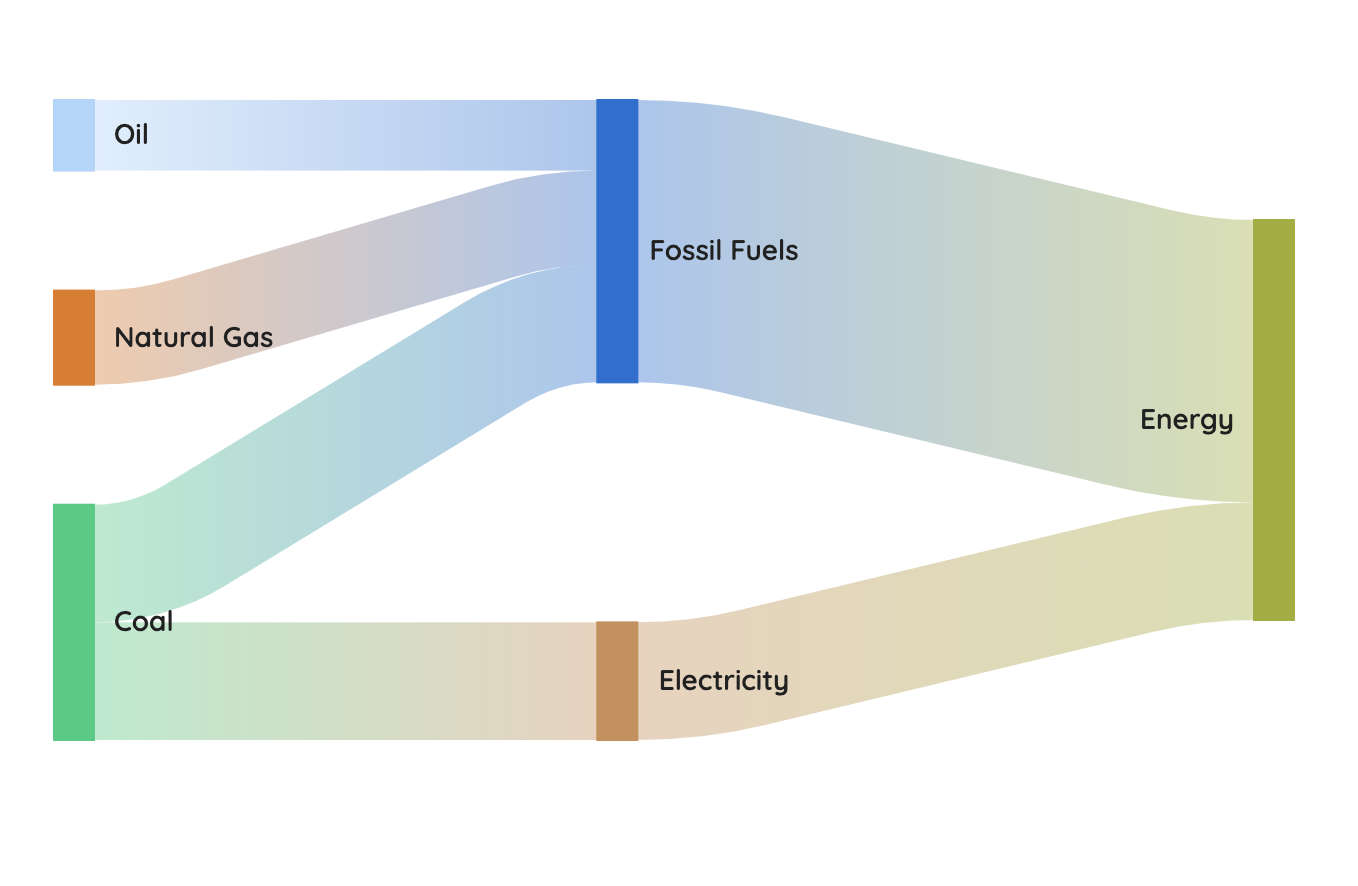
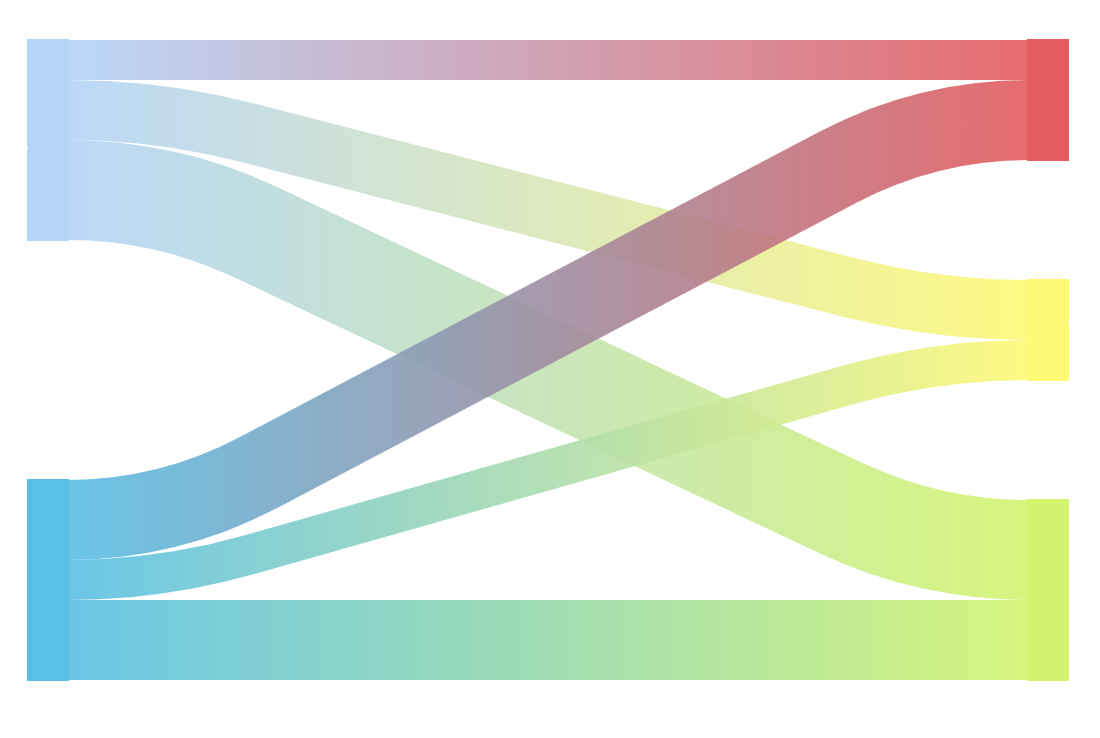
Elevate the visual aesthetics of your Sankey charts by applying customizable gradients or solid color fills to the links.
This feature enhances the overall look and feel, making the charts not only more attractive but also more effective in conveying complex data.


Please wait...