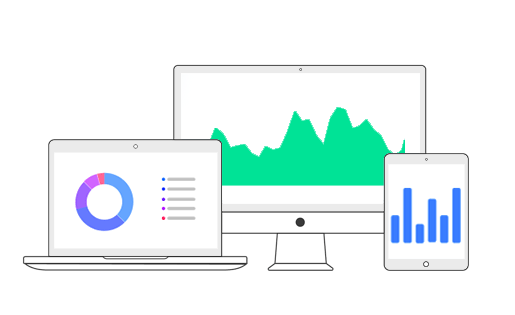
Responsive
ApexCharts scales gracefully in desktops, tablets as well as mobiles. You can set responsive queries and can have different layouts for different screen sizes.
Interactive
Zoom, Pan, Scroll through data, toggle datasets visibility in multiple series, show informative tooltips when user hovers over datapoints. Each of these options helps to communicate data more effectively.
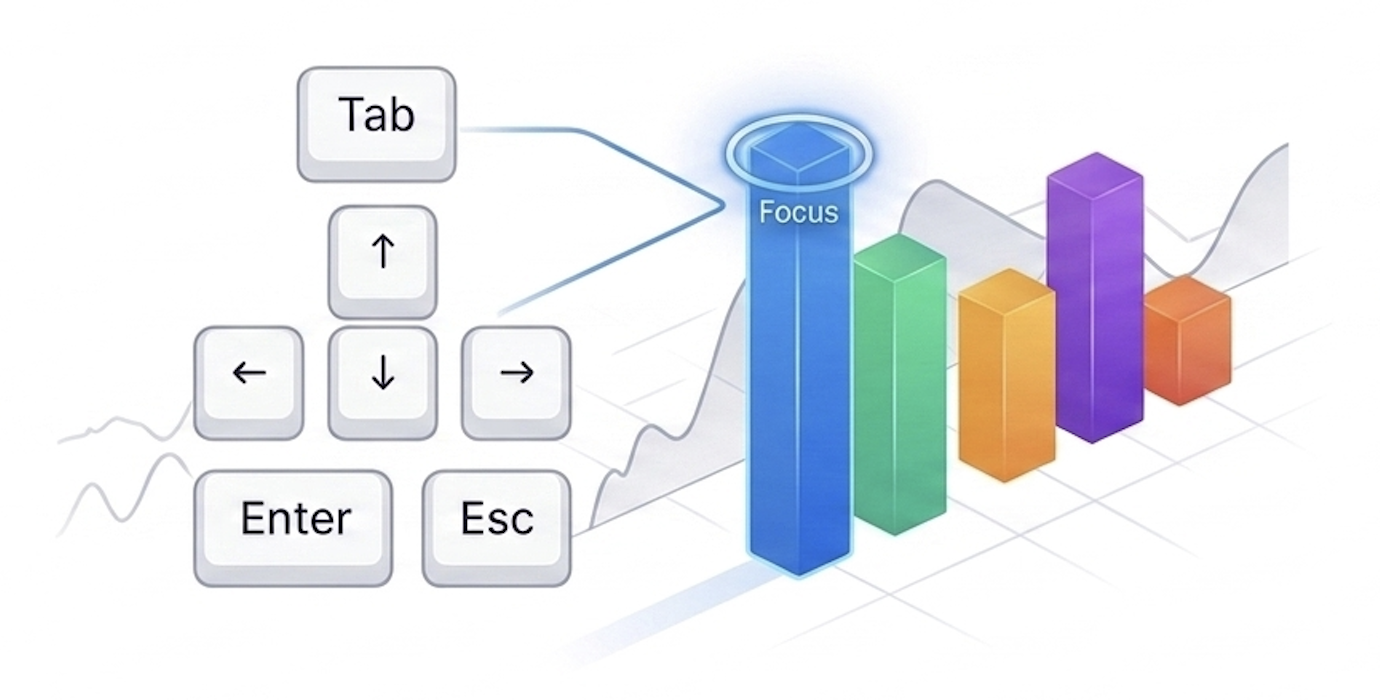
Accessibility
ApexCharts ships with built-in keyboard navigation, ARIA attributes, and screen reader support - enabled by default with no extra configuration. Every chart type supports arrow-key traversal across data points and series, with Enter and Space firing click events just like a mouse.
Color-blind–friendly palettes (deuteranopia, protanopia, tritanopia, high-contrast) swap in automatically via a single config option.
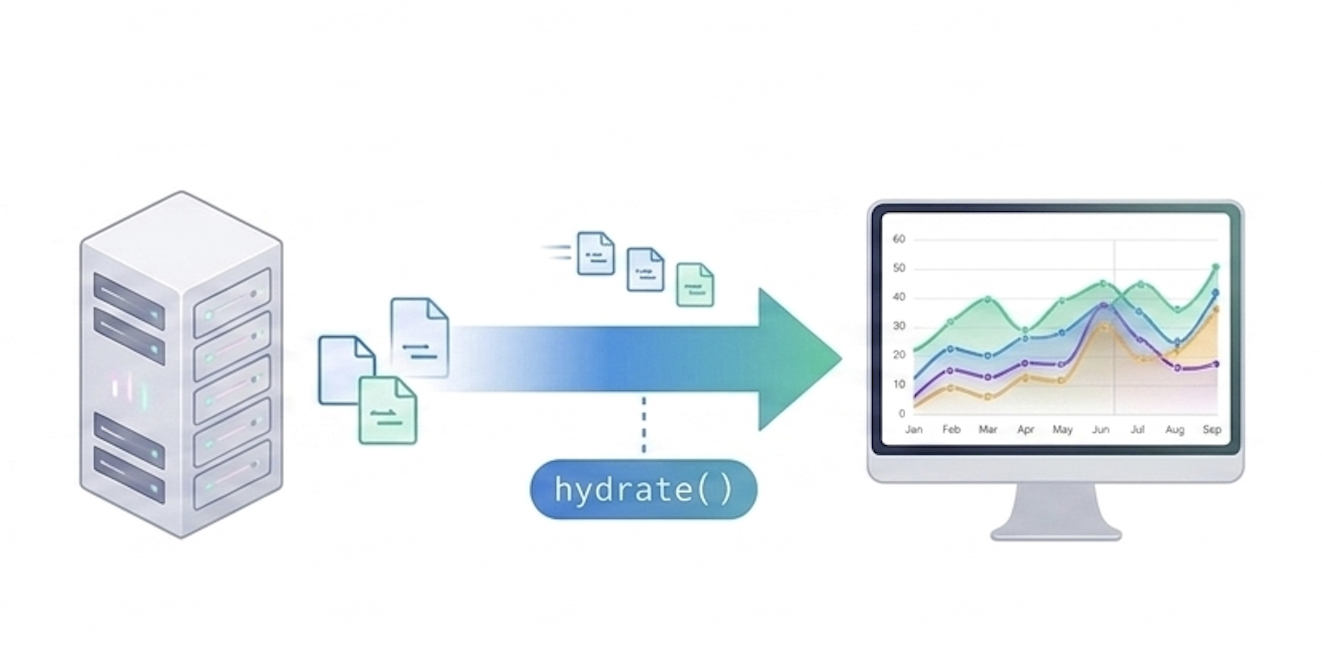
Server-Side Rendering
Render charts to static SVG on the server using apexcharts/ssr, then restore full interactivity in the browser with a single hydrateAll() call. Charts are immediately visible to users and search engines - no layout shift, no blank canvas on load.
Works out of the box with Next.js, Nuxt, SvelteKit, Astro, and any other SSR meta-framework.
High Performance
Along with providing a pleasing appearances to your charts, ApexCharts gives high performance too.
Test it out yourself by rendering large number of datapoints.

Annotations
Annotate your charts by placing labels on top of it to help your users interpret charts easily. You may add annotations on both the axes as well as on a particular xy point.
Smooth Animations
ApexCharts provides a smooth interactive experience when changing datasets, loading dynamic data and interacting with the charts.
Checkout the animations demo to see live example
Styling chart elements
Add gradients, images, patterns and dropshadows to chart elements and give your charts a customized look.
Theme Palettes
ApexCharts has 10+ color palettes to choose from. Select a predefined color theme or create your own.