Turn Raw Data into Compelling Visuals in Minutes
The ApexCharts Graph Maker lets you create polished data visualizations without writing a single line of code. Start from a template, customize every detail, and share your charts with the world.

Customize Everything
Change colors, fonts, backgrounds, borders, and every other aspect of your chart. Make it match your brand perfectly.
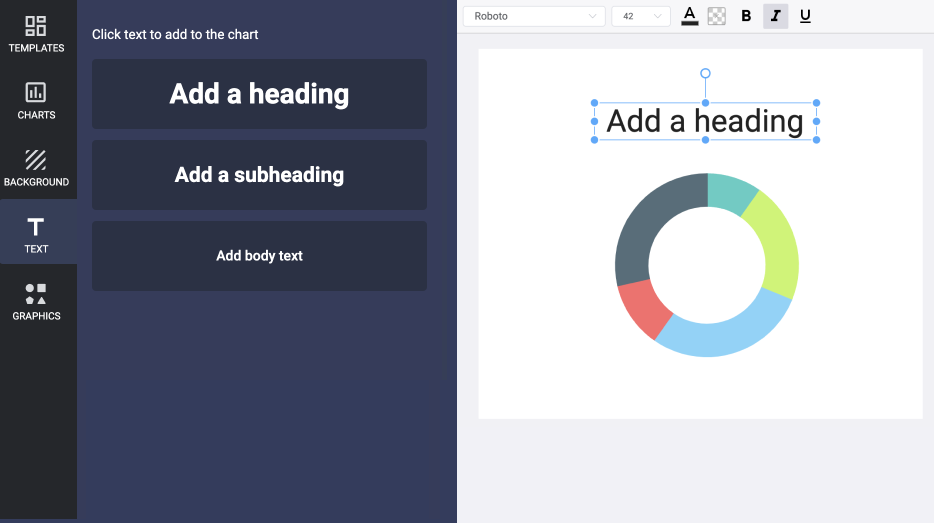
Add Text, Images & More
Enhance your charts with text annotations, custom images, watermarks, and more to tell a complete data story.
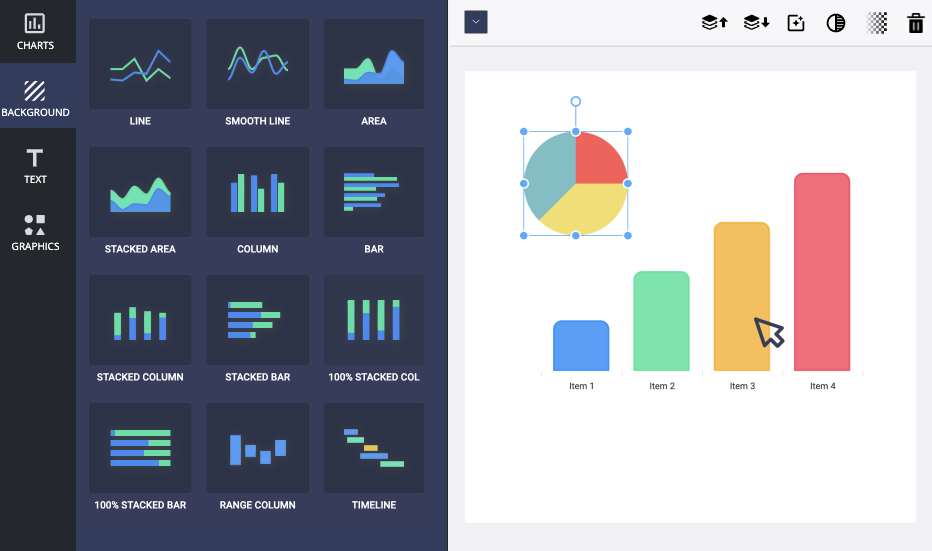
Library of Templates
Start from a rich library of chart templates, or build from scratch.
Brand Kit
Apply your brand fonts and colors for on-brand charts every time.
Drag and Drop
A simple drag-and-drop editor that anyone on your team can use.
Export
Download finished graphs as JPG, PNG or SVG.
Frequently Asked Questions
What is ApexCharts Graph Maker?
ApexCharts Graph Maker is a free online tool that allows you to create beautiful charts and graphs without writing any code. Choose from a library of templates, customize everything, and export your visualizations.
How to create a graph using ApexCharts Graph Maker?
Simply visit editor.apexcharts.com, choose a template or start from scratch, input your data, customize colors and styling, and export your chart as an image or embed it on your website.
What chart types are available in the template?
The graph maker supports all chart types available in ApexCharts: line, area, bar, column, pie, donut, radar, heatmap, treemap, candlestick, scatter, bubble, and many more.
Ready to create your first chart?
Free to use. No signup required, start building in your browser.
Create Graphs Now