Bar Chart
What is a Bar Chart?
Bar Charts (also Bar Graphs) are among the most common types of charts used for displaying comparisons between several categories of data and variations of different values. A bar chart is oriented horizontally or vertically using rectangular bars with different lengths that are proportional to the value they visualize. You can display long data labels as the horizontal rectangles have enough room to fit textual information.
There are several types of bar charts, including basic horizontal bar charts, stacked bar charts, reversed bar charts, and more.
When to use a bar chart
Use a bar chart when:
- Category labels are long strings that would overlap on a vertical column chart.
- You are ranking items from highest to lowest (easiest to read left-to-right).
- You have 5-20 categories to compare.
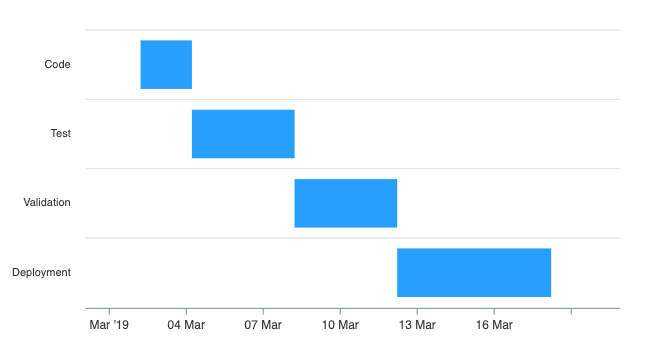
Avoid a bar chart for time-series data. Time flows naturally left to right, so a column chart or line chart is more intuitive for ordered time categories.
Bar chart vs column chart
Both show the same data. The difference is orientation: a bar chart is horizontal, a column chart is vertical. In ApexCharts, both use chart.type: 'bar'. A bar chart sets plotOptions.bar.horizontal: true; a column chart omits it (defaults to false).
Choose horizontal bars when category names are long. Choose vertical columns when the x-axis is time or ordered sequence.
Data Format
The data format for a bar chart is the same as for the other XY charts. You need to provide your data in the series array in chart options. More information about how to build the series can be found at Working with data page.
How to make a bar chart
In the following sections, will go through the configuration and options to plot different types of bar charts, will help you lean how to add markers on horizontal bar charts, how to display bars that are stacked on top of each other, and will show you a few bar graph examples.
Basic Horizontal Bar Chart
To create a basic JavaScript bar chart, the most important properties are the chart.type and plotOptions.bar.horizontal described as below
options = {
  chart: {
    type: 'bar'
  },
  plotOptions: {
    bar: {
      horizontal: true
    }
  },
  series: [{
    data: [{
      x: 'category A',
      y: 10
    }, {
      x: 'category B',
      y: 18
    }, {
      x: 'category C',
      y: 13
    }]
  }]
}
A simple example of a basic Horizontal Bar Chart
Adding markers
Markers on a horizontal bar chart are useful for comparisons or they can be helpful in providing additional information related to the particular data-point.
Note: Markers don't work with stacked charts
{
  x: 'Category A',
  y: 54,
  goals: [
    {
      name: 'Expected',
      value: 52,
      strokeColor: '#775DD0'
    }
  ]
}

What is a Stacked Bar Chart and how to plot one?
A stacked bar chart, or a stacked bar graph, is a type of Bar Chart used for breaking down a larger category into subsegments or sub-values and comparing them to see which subcategory or sub-value shares a bigger portion in the whole.
There are 2 variants of Stacked Bar Charts.
Normal Stacked Bar Charts
The bars are stacked on top of each other based on their values.
chart: {
  stacked: true
}

100% Stacked Bar Charts
The bars are stacked on top of each other based on their percentage or weightage among the groups.
chart: {
  stacked: true,
  stackType: "100%"
}

Changing the color of a particular data-point
Oftentimes, we need to distinguish or highlight a certain data point from the rest of the data. In such cases, we can inject the colors for that data point when we build the series. Below is an example
series: [{
  data: [{
    {
      x: 'Category A',
      y: 6653
    }, {
      x: 'Category B',
      y: 8133,
      fillColor: '#EB8C87',
      strokeColor: '#C23829'
    }, {
      x: 'Category C',
      y: 7132
    }
  }]
}]
When to use a Bar Chart?
As Bar Charts and graphs are very easy to interpret, they are ideal for visualizing comparative data through a chart. Also, they are very suitable for scenarios like sales management, inventory management, or stock charting with some of the most common use cases including:
- When you want to show trends or variations in the value of an item across time.
- When comparing data values of one or multiple data series.
- In case you have to examine several data points grouped in sub-categories.
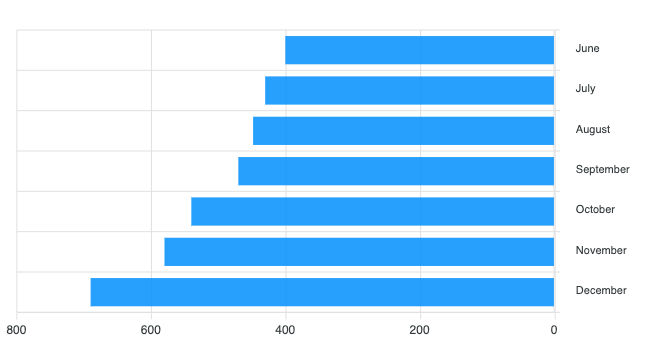
Reversed Chart
A reversed bar chart is a mirrored chart that goes from right to left instead of left to right. The following configuration will make a mirrored graph.
yaxis: {
  reversed: true
}
Related Chart Types
Check out the related chart types guide to learn more about integrating different types of graphs available in ApexCharts.
[

Column Chart Guide
](/docs/chart-types/column-chart/)[
RangeBar Chart Guide
](/docs/chart-types/range-bar-chart/)[

BoxPlot Chart Guide
](/docs/chart-types/boxplot/)