DataLabels
Data Labels are the actual values which are passed in the series. You can add formatters which will allow you to modify values before displaying.
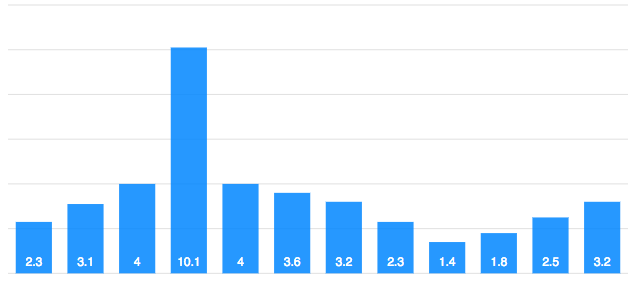
Changing dataLabels position
Setting Position to top in a bar chart
For columns/bar chart, there is an additional dataLabels property provided in the plotOptions.bar.dataLabels
plotOptions: {
  bar: {
    dataLabels: {
      position: 'top'
    }
  }
},
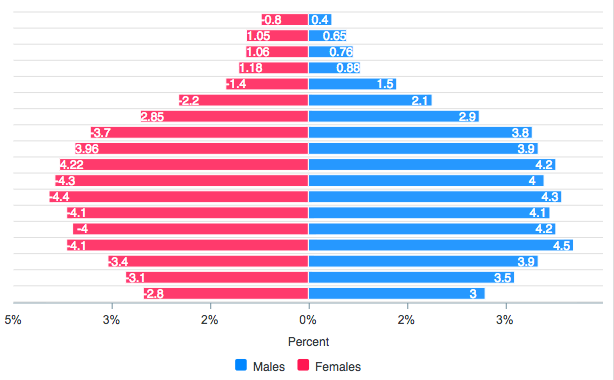
DataLabels offset
By default, the dataLabels stay inside the column/bar. If we want to move the dataLabels outside bar/column, we need to set the offsetX/offsetY property
plotOptions: {
  bar: {
    dataLabels: {
      position: 'top'
    }
  },
  dataLabels: {
    enabled: true,
    style: {
        colors: ['#333']
    },
    offsetX: 30
  },
},
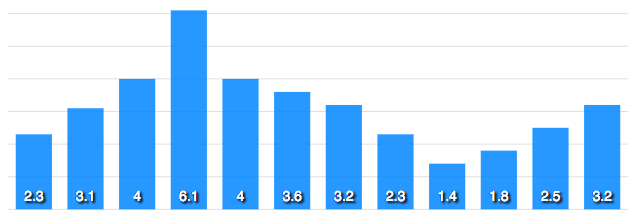
Setting Position to bottom
By changing the plotOptions.bar.dataLabels.position to bottom, the column chart looks like
plotOptions: {
  bar: {
    horizontal: false,
    dataLabels: {
      position: 'bottom'
    }
  }
},
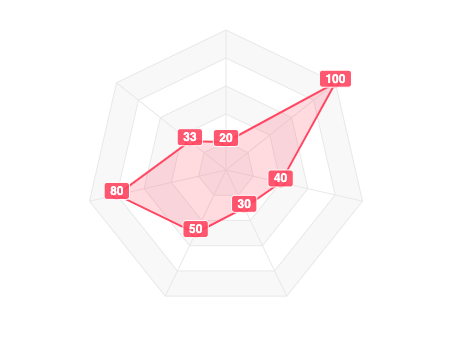
Customizing the DataLabels appearance
To style the text, you can set the font size, font weight of the data label. To style the background rect that appears behind the text, you can customize as shown in the below code snippet
dataLabels: {
  style: {
    fontSize: '12px',
    fontWeight: 'bold',
  },
  background: {
    enabled: true,
    foreColor: '#fff',
    borderRadius: 2,
    padding: 4,
    opacity: 0.9,
    borderWidth: 1,
    borderColor: '#fff'
  },
},
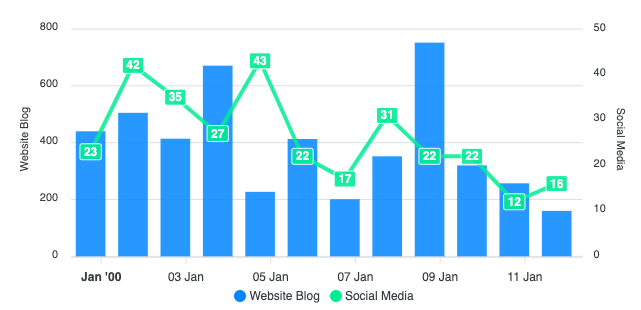
Hiding DataLabels on certain series
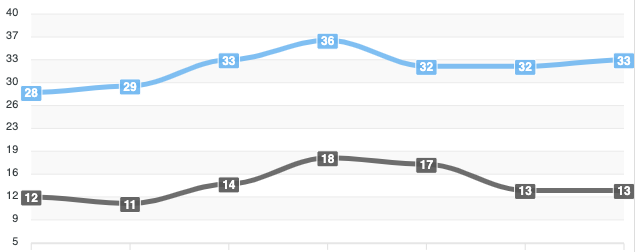
In a multi-series or a combo chart, if you don't want to show labels for all the series to avoid jamming up the chart with text, you can do it with the enabledOnSeries property.
This property accepts an array in which you have to put the indices of the series you want the data labels to appear.
dataLabels: {
  enabled: true,
  enabledOnSeries: [1]
},
In the above code, data labels will appear only for series index 1.
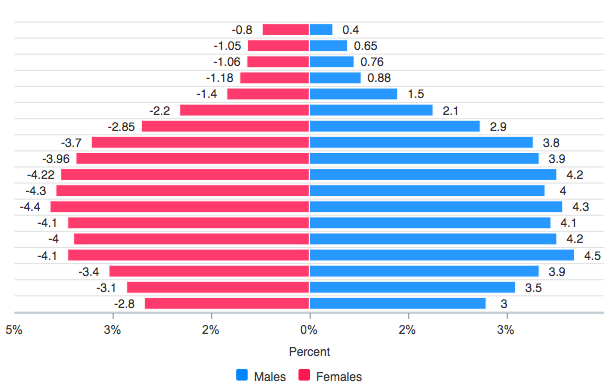
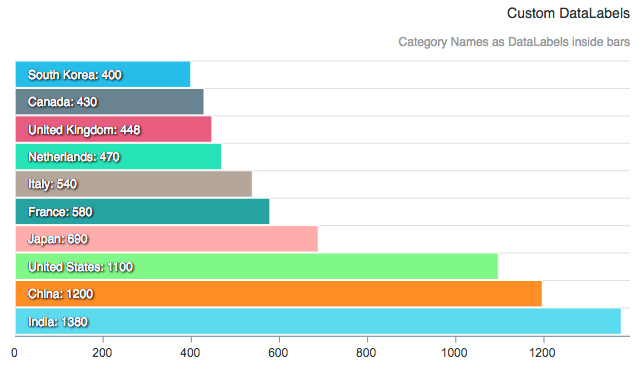
Custom DataLabels
You can use the formatter of dataLabels and modify the resulting label. The below example shows how you can display xaxis categories/labels as dataLabels in a horizontal bar chart.
dataLabels: {
  enabled: true,
  textAnchor: 'start',
  formatter: function(val, opt) {
      return opt.w.globals.labels[opt.dataPointIndex] + ":  " + val
  },
  offsetX: 0,
},
View the full example at this demo page
DataLabels Dropshadow
You can apply a drop-shadow to the data label to make it more stand out in a colorful chart.
dataLabels: {
  enabled: true,
  dropShadow: {
      enabled: true,
      left: 2,
      top: 2,
      opacity: 0.5
  }
}
Formatting data labels as currency or percentage
Use the formatter function to transform the raw value before it is displayed. The formatter receives the value and a context object that includes series and data point indices.
Currency:
dataLabels: {
  enabled: true,
  formatter: function(value, { seriesIndex, dataPointIndex, w }) {
    // Currency
    return '$' + value.toFixed(0).replace(/\B(?=(\d{3})+(?!\d))/g, ',')
  }
}
Percentage (for pie/donut where value is already a percentage):
dataLabels: {
  formatter: function(value) {
    return value.toFixed(1) + '%'
  }
}
For the full set of options available for dataLabels, see dataLabels configuration