Grid
Grid is the plot area excluding legends, title, subtitle, x-axis, and y-axis. Grid's coordinates are used extensively in calculations in the chart in determining where to plot the actual chart elements.
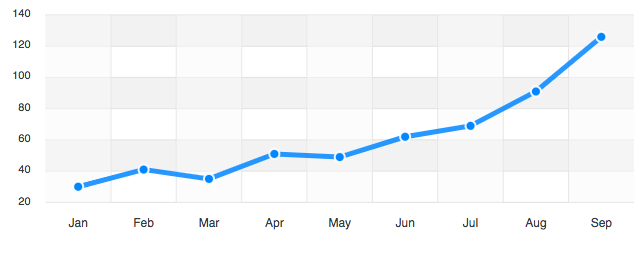
Customizing Grid
Putting gridlines above chart area
The gridlines can be drawn above the chart area by setting the grid.position to front
grid: {
  position: 'front'
}
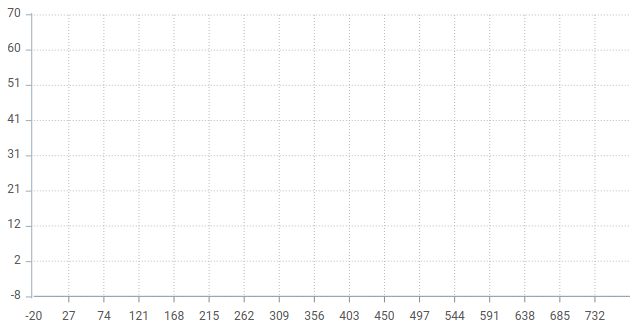
Show/hide lines
Control visibility of x-axis/y-axis gridlines
xaxis: {
  lines: {
    show: false,
  }
},
yaxis: {
  lines: {
    show: true,
  }
},
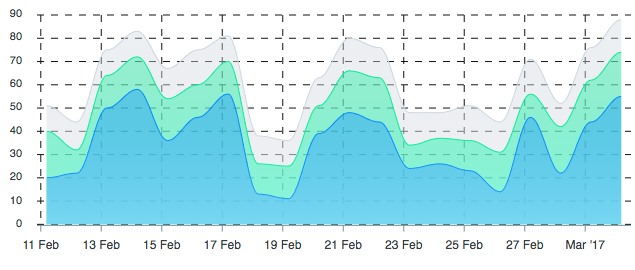
Styling Grid
Changing grid border color and giving a dashed look
You can customize the grid's lines colors and give a dashed border by setting
grid: {
  borderColor: '#111',
  strokeDashArray: 7,
}
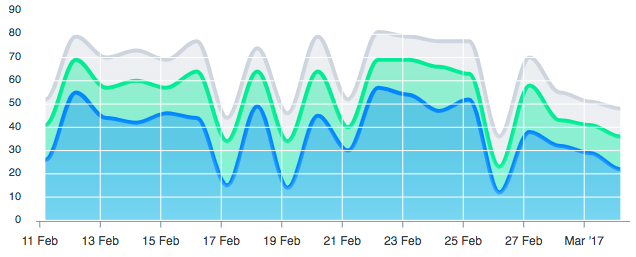
Filling grid rows and columns
You can fill the backgrounds of the grid rows and column by setting
grid: {
  row: {
      colors: ['#e5e5e5', 'transparent'],
      opacity: 0.5
  },
  column: {
      colors: ['#f8f8f8', 'transparent'],
  },
  xaxis: {
    lines: {
      show: true
    }
  }
},
For more information on Grid, please refer to Grid configuration