line
Configuration Structure
line: {}plotOptions
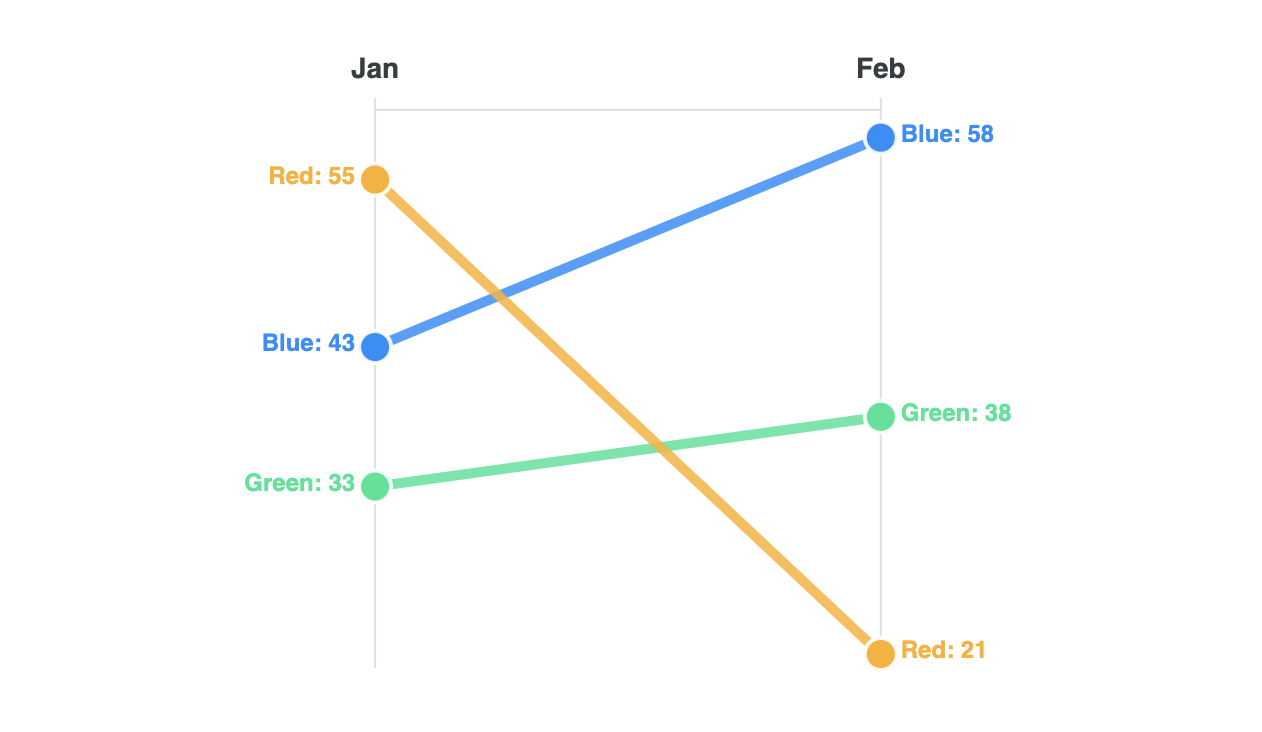
isSlopeChart
This flag adjusts the axes as well as data-labels to give it a slope chart look. A slope chart is useful when comparing different categories as the direction of the lines highlight variations clearly.
Here is a demo of a slope chart
colors
threshold
A threshold value to use when coloring the chart with 2 different colors. Useful when showing positive/negative relation in a line/area chart.
colorAboveThreshold
Color to fill with when values are greater than threshold
colorBelowThreshold
Color to fill with when values are smaller than threshold