Title
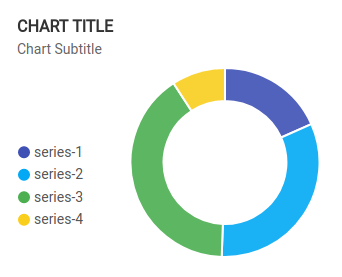
ApexCharts renders a built-in title and subtitle above the chart area using the title and subtitle options, so you can label your visualizations without managing additional DOM elements.
Basic title
Set title.text to the string you want displayed. Use title.align to position it: 'left', 'center', or 'right'. The default alignment is 'left'.
var options = {
  chart: {
    type: 'line'
  },
  title: {
    text: 'Monthly Revenue',
    align: 'center'
  },
  series: [{
    name: 'Revenue',
    data: [30, 40, 35, 50, 49, 60, 70]
  }],
  xaxis: {
    categories: ['Jan', 'Feb', 'Mar', 'Apr', 'May', 'Jun', 'Jul']
  }
}

var chart = new ApexCharts(document.querySelector('#chart'), options)
chart.render()
Subtitle
subtitle.text renders a second line directly below the main title. Both title and subtitle share the same align options. You can set them independently.
var options = {
  chart: {
    type: 'line'
  },
  title: {
    text: 'Monthly Revenue',
    align: 'left'
  },
  subtitle: {
    text: 'Fiscal Year 2026',
    align: 'left'
  },
  series: [{
    name: 'Revenue',
    data: [30, 40, 35, 50, 49, 60, 70]
  }],
  xaxis: {
    categories: ['Jan', 'Feb', 'Mar', 'Apr', 'May', 'Jun', 'Jul']
  }
}

var chart = new ApexCharts(document.querySelector('#chart'), options)
chart.render()
Styling
Control the title appearance with the style object. The supported properties are fontSize, fontWeight, and color.
var options = {
  chart: {
    type: 'bar'
  },
  title: {
    text: 'Quarterly Sales',
    align: 'center',
    style: {
      fontSize: '20px',
      fontWeight: 'bold',
      color: '#263238'
    }
  },
  subtitle: {
    text: 'All regions combined',
    align: 'center',
    style: {
      fontSize: '14px',
      fontWeight: 'normal',
      color: '#90a4ae'
    }
  },
  series: [{
    name: 'Sales',
    data: [44, 55, 41, 67]
  }],
  xaxis: {
    categories: ['Q1', 'Q2', 'Q3', 'Q4']
  }
}

var chart = new ApexCharts(document.querySelector('#chart'), options)
chart.render()
fontSize accepts any CSS font-size string. fontWeight accepts a numeric weight (e.g. 600) or a keyword ('bold', 'normal').
Vertical offset
title.offsetY shifts the title up or down by the given number of pixels. A positive value moves it down; a negative value moves it up. This is useful when you have a custom toolbar or a legend positioned at the top and need to nudge the title to avoid overlap.
title: {
  text: 'Sales Overview',
  offsetY: 16
}
subtitle.offsetY works the same way and is applied relative to the subtitle's natural position.
Dynamic title update
Use chart.updateOptions() to change the title after the chart has rendered, for example in response to a filter or date-range selection.
var options = {
  chart: {
    type: 'line',
    id: 'revenue-chart'
  },
  title: {
    text: 'Revenue: All Time',
    align: 'left'
  },
  series: [{
    name: 'Revenue',
    data: [30, 40, 35, 50, 49, 60, 70]
  }],
  xaxis: {
    categories: ['Jan', 'Feb', 'Mar', 'Apr', 'May', 'Jun', 'Jul']
  }
}

var chart = new ApexCharts(document.querySelector('#chart'), options)
chart.render()

// Later, when the user selects a date range:
document.querySelector('#filter-btn').addEventListener('click', function () {
  chart.updateOptions({
    title: {
      text: 'Revenue: Last 30 Days'
    }
  })
})
updateOptions merges the new values with the existing config, so you only need to pass the properties you want to change.