Sunburst Chart
What is a Sunburst Chart?
A sunburst chart is a hierarchical radial chart, a nested pie or donut. It draws tree-structured data as concentric rings: the innermost ring is the top level of the hierarchy, each ring outward is one level deeper, and every child arc is nested inside the angular span of its parent. It answers "what is this made of, and what is that made of" in a single view.
It is a non-axis chart type (no grid or scale, dispatched like a pie or treemap), added in ApexCharts 6.7. Where a treemap shows a hierarchy as nested rectangles and drilldown reveals one level at a time, a sunburst shows the whole tree at once in a radial layout, with optional click-to-zoom.
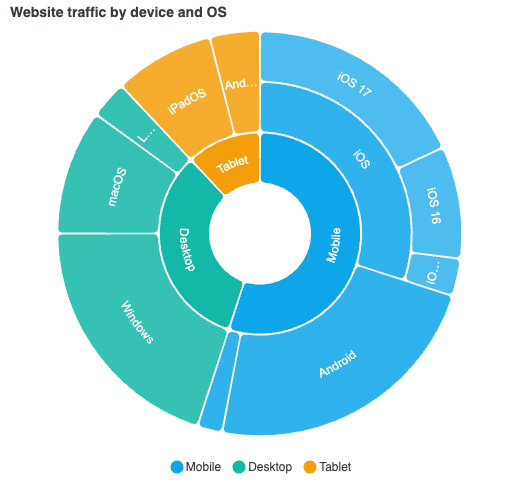
Data Format
A sunburst reads a single series whose data points carry a children array, in the familiar x / y shape. Each node's y is its value; a parent with children is sized by the sum of its subtree.
const chart = new ApexCharts(el, {
  chart: { type: 'sunburst' },
  series: [{
    data: [
      { x: 'Mobile', y: 55, children: [
        { x: 'iOS', y: 30, children: [
          { x: 'iOS 17', y: 18 },
          { x: 'iOS 16', y: 9 },
        ]},
        { x: 'Android', y: 23 },
      ]},
      { x: 'Desktop', y: 33, children: [
        { x: 'Windows', y: 20 },
        { x: 'macOS', y: 10 },
      ]},
    ],
  }],
})
chart.render()
Set chart.type to sunburst and pass the hierarchy; that is enough for a basic chart. Colours, stroke, legend, and title behave as they do on a pie or donut, and each depth level is tinted lighter than its parent so a branch reads as one family of arcs.
The Donut Hole
plotOptions.sunburst.innerSize sets the radius of the centre hole, as a percentage of the maximum radius (or a pixel value), exactly like a donut's size. It defaults to '15%'. Set it to '0%' for a solid nested pie, or larger for an airier ring.
plotOptions: {
  sunburst: {
    innerSize: '25%',
  },
}
Rounded and Spaced Arcs
borderRadius rounds the corners of every arc and spacing opens a gap between neighbouring arcs, so a sunburst can read as a set of separated, soft-cornered segments rather than a solid wheel. Both share their semantics with the pie family (see plotOptions.pie).
plotOptions: {
  sunburst: {
    borderRadius: 5,
    spacing: 2,
  },
}
Click to Zoom
By default, clicking a wedge zooms into that branch: its subtree expands to fill the chart and a breadcrumb lets you walk back out. Click the focused inner ring to zoom out one level. Set plotOptions.sunburst.zoomOnClick to false to disable it and keep the chart static. Every sunburst demo below is zoomable, so click into any wedge to try it.
From a Drilldown Config
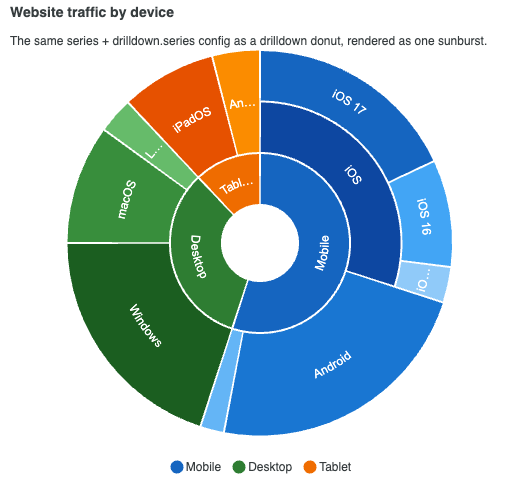
A drilldown chart's data is already a hierarchy: the top-level series plus the drilldown.series entries each slice points at. A sunburst reads that same config directly, so an existing drilldown donut becomes a sunburst by flipping chart.type to sunburst, with no change to the data. Per-level colors from the drilldown entries are honoured.
const chart = new ApexCharts(el, {
  chart: { type: 'sunburst' },
  series: [{
    data: [
      { x: 'Mobile', y: 55, drilldown: 'mobile' },
      { x: 'Desktop', y: 33, drilldown: 'desktop' },
    ],
  }],
  drilldown: {
    series: [
      { id: 'mobile', data: [{ x: 'iOS', y: 30 }, { x: 'Android', y: 23 }] },
      { id: 'desktop', data: [{ x: 'Windows', y: 20 }, { x: 'macOS', y: 10 }] },
    ],
  },
})
chart.render()
Semi-Circle Sunburst
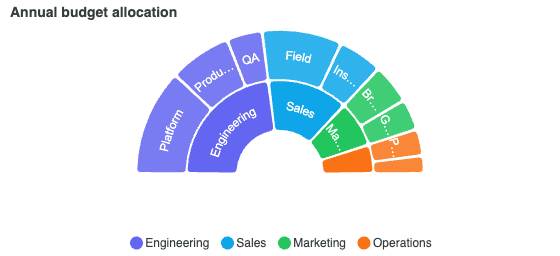
startAngle and endAngle rotate and crop the ring, just as they do on a pie or radialBar. A -90 to 90 span gives a half-ring that reads well for a part-to-whole where a semicircle is a better fit than a full circle.
plotOptions: {
  sunburst: {
    startAngle: -90,
    endAngle: 90,
  },
}
Ragged Hierarchies
When a branch bottoms out before the deepest level in the tree, plotOptions.sunburst.leaf decides how it is drawn. 'extend' (the default) stretches the leaf arc out to the rim so the ring stays solid; 'stop' leaves the outer rings empty behind it, showing exactly how deep each branch runs.
Tree-Shaking
The sunburst is tree-shakeable. Import the core build and add the sunburst entry, and a sunburst-only bundle pulls in none of the other chart types:
import ApexCharts from 'apexcharts/core'
import 'apexcharts/sunburst'
When to Use a Sunburst Chart
- To show a part-to-whole breakdown that itself breaks down further (region to country to product; device to OS to version).
- To present a whole hierarchy at once, radially, rather than one drilldown level at a time.
- As a nested pie or donut when a flat pie hides the structure inside each slice.
More configuration specific to the JavaScript sunburst chart can be accessed at this page.