Comparison Table

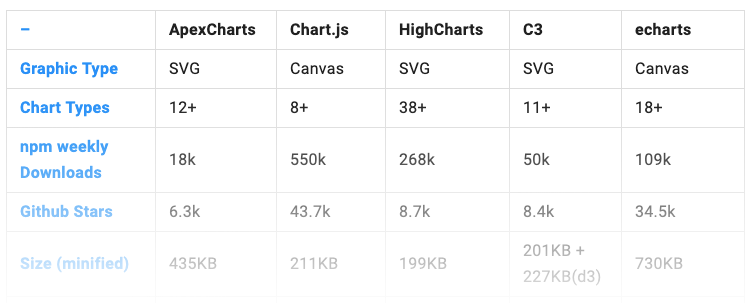
The below table tries to provide an illustration of the similarities/differences among different JavaScript Charting libraries available.
| – | ApexCharts | Chart.js | HighCharts | C3 | echarts |
| Graphic Type | SVG | Canvas | SVG | SVG | Canvas |
| Dependency | – | chartjs-color, moment | – | D3 | zrender |
| Chart Types | 12+ | 8+ | 38+ | 11+ | 18+ |
| npm weekly Downloads | 18k | 550k | 268k | 50k | 109k |
| Github Stars | 6.3k | 43.7k | 8.7k | 8.4k | 34.5k |
| Size (minified) | 435KB | 211KB | 199KB | 201KB + 227KB(d3) | 730KB |
| Documentation | Good | Confusing | Good | Good | Poor English translations |
| Since | 2018 | 2013 | 2010 | 2014 | 2013 |
| License | MIT | MIT | Commercial (Free for personal use) | MIT | BSD 3 Clause |

Please wait...