Trusted by developers
15,000+
Stars on GitHub
6 Million+
Monthly npm downloads
20+
Chart types supported
From config to chart in seconds
Integrating visualizations with ApexCharts is as simple as it can get with extensive API docs and 100+ samples ready to be used.
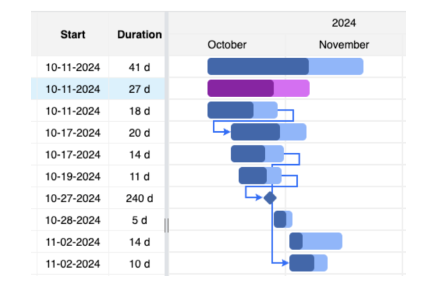
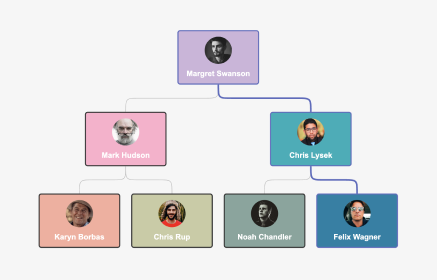
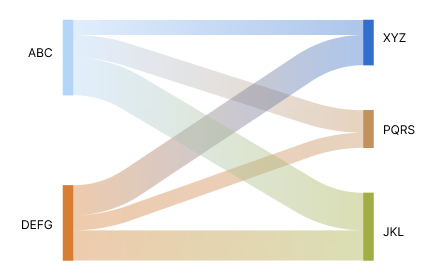
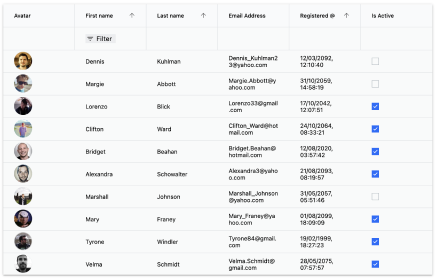
Several Chart Types
Choose from a wide range of charts. Create a combination of different charts to provide a clear difference between data.
Fully Responsive
ApexCharts are flexible and responsive — making your charts work on desktops, tablets as well as mobiles.
Highly Customizable
Configuring ApexCharts is easy-peasy. Our comprehensive docs will help you setting up your charts quickly.