Access a comprehensive suite of technical indicators to enhance your market analysis. ApexStock provides essential tools including Moving Averages, Bollinger Bands, MACD, RSI, Fibonacci Retracements, and many more. Each indicator is seamlessly integrated with the primary chart for a cohesive analysis experience.
Indicators can be overlaid directly on price charts or displayed as separate panels below the main chart, giving you flexible visualization options to suit your analysis style.
Annotate and analyze charts with ApexStock's comprehensive drawing toolkit. Create trend lines, rectangles, and circles, to identify chart patterns and support/resistance zones. Add text annotations to document your analysis.
Switch seamlessly between multiple chart types to gain different perspectives on price action. View data as candlesticks for traditional analysis, or switch to Heikin-Ashi candles for trend identification. Other options include OHLC bars, line, area, and bar charts.
The intuitive chart type selector makes it easy to toggle between different visualizations without losing your current analysis setup, indicators, or drawings.
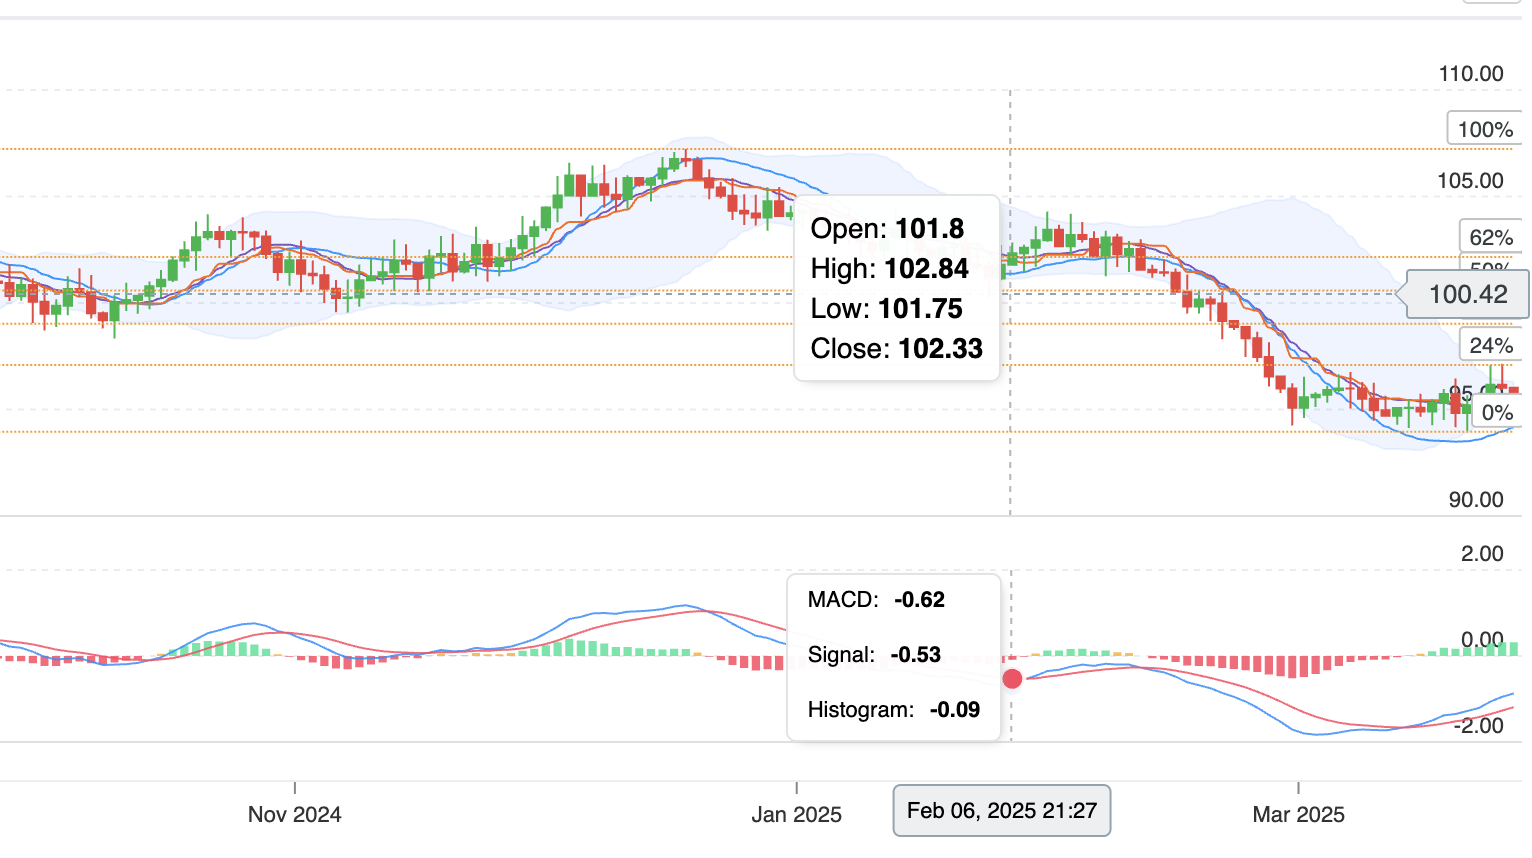
Tooltip Pinning
Pin price information tooltips directly to your chart to create persistent reference points. Pinned tooltips remain visible during chart navigation and can be positioned, moved, or deleted like other drawing elements.
Advanced Time Navigation
The responsive time axis automatically adjusts tick density and formatting based on the current zoom level, showing appropriate minute, hour, day, week, or month labels.
Smooth Navigation
Navigate large datasets effortlessly with intuitive zooming and panning controls. The responsive chart maintains high performance even with thousands of data points, allowing seamless exploration of historical data.
Chart Exporting
Capture and share your technical analysis with high-quality exports. Save charts as SVG files with all your annotations, indicators, and drawings preserved for documentation or sharing with colleagues.
Ready to enhance your financial applications?
Start building powerful stock charts with ApexStock today.
APEXSTOCK DEMOS
Please wait...