Angular Chart Demos > Line Charts
Line Charts
Basic Line Chart
Line Chart with DataLabels
Zoomable Timeseries
Line with Annotations

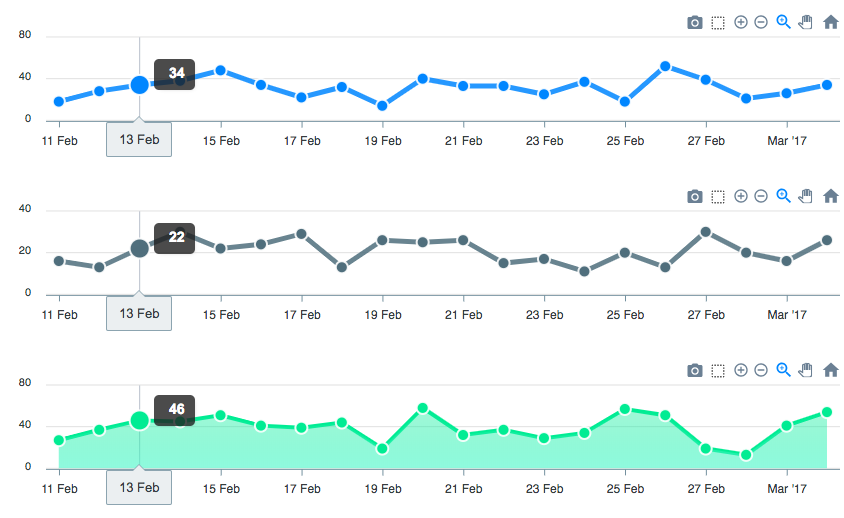
Syncing Charts

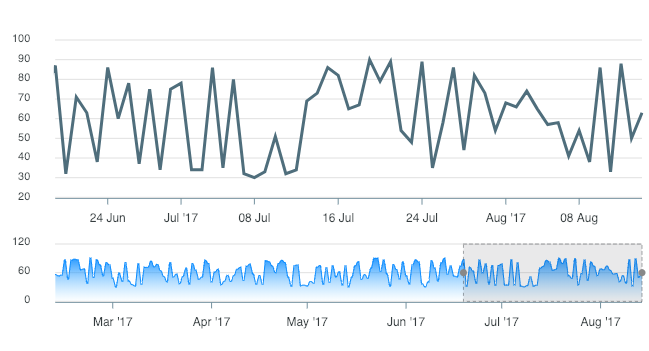
Brush Chart

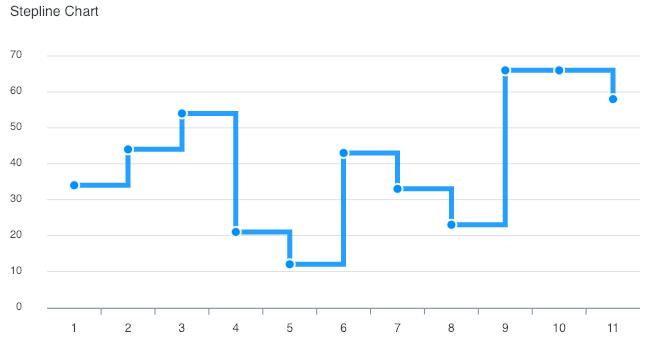
Stepline Chart
Gradient Line Chart
Missing / Null values
Dashed Line Chart
Need Advanced Line Chart Features?
We have partnered with Infragistics so you can visualize your data the way you prefer with Ignite UI for Angular Line Chart component. Use it to show data variables and trends in a clear and precise way, plot multiple series in a single chart, or simply apply the built-in shapes to mark data points. The Angular Line Chart is capable of handling millions of data sets with ease and can be updated with live data every few milliseconds. Complemented by smooth animation, zooming, panning support, legends, and more.
