Icicle Chart
What is an Icicle Chart?
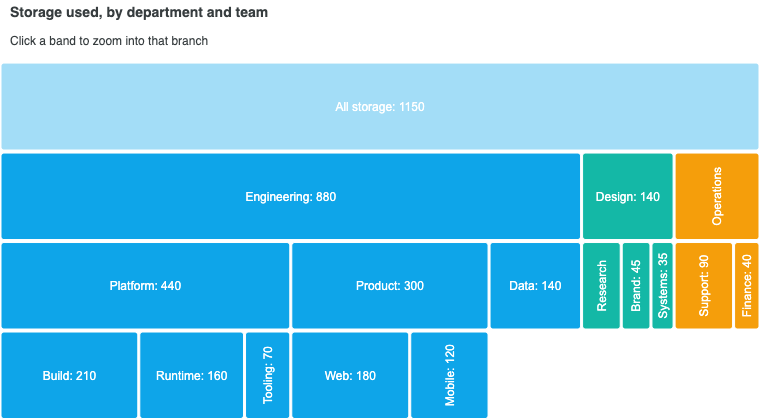
An icicle chart is a cartesian partition chart. It draws tree-structured data as one band per level of the hierarchy: the root band spans the whole value axis, and each child cell is nested inside its parent's extent on the next band along. It answers "what is this made of, and what is that made of" while keeping every level on a common scale you can read across.
It is the sunburst's layout in cartesian coordinates. The two take exactly the same data and differ only in whether the levels are drawn as rings or as bands. Straight bands give you room for labels and make two cells on the same level directly comparable by length, which is why the profiling world settled on this shape rather than the radial one. Added in ApexCharts 7.6.
Loading the Icicle Bundle
The icicle has never been in the default bundle, so importing apexcharts alone does not draw one. Add its entry next to the default bundle:
import ApexCharts from 'apexcharts'
import 'apexcharts/icicle'
With a script tag, add the sub-entry after the ApexCharts script:
<script src="https://cdn.jsdelivr.net/npm/apexcharts"></script>
<script src="https://cdn.jsdelivr.net/npm/apexcharts/dist/icicle.js"></script>
Or load the full bundle, which has every chart type and feature, the icicle included: import ApexCharts from 'apexcharts/full', or apexcharts.full.min.js from a script tag.
Miss this and the chart draws nothing, with one console line naming what to add: chart type "icicle" is not registered. If you see that, the import is what is missing.
Data Format
An icicle reads a single series whose data points carry a children array, in the familiar x / y shape. Each node's y is its value, and a parent with children is sized by the sum of its subtree. This is the same shape a sunburst and a treemap take.
const chart = new ApexCharts(el, {
  chart: { type: 'icicle' },
  series: [{
    data: [
      { x: 'All storage', children: [
        { x: 'Engineering', children: [
          { x: 'Platform', children: [
            { x: 'Build', y: 210 },
            { x: 'Runtime', y: 160 },
          ]},
          { x: 'Data', y: 140 },
        ]},
        { x: 'Design', y: 140 },
      ]},
    ],
  }],
})
chart.render()
Set chart.type to icicle and pass the hierarchy; that is enough for a basic chart.
Growth Direction
plotOptions.icicle.direction decides which way the tree grows from the root. 'down' (the default) puts the root band on top with each level below its parent. 'up' puts the root at the bottom, which is the flame-graph orientation. 'right' and 'left' grow sideways, which suits long labels: a cell's width is then the band thickness rather than its share of the value axis, so names have room to read.
plotOptions: {
  icicle: {
    direction: 'up',
  },
}
Flame Graphs
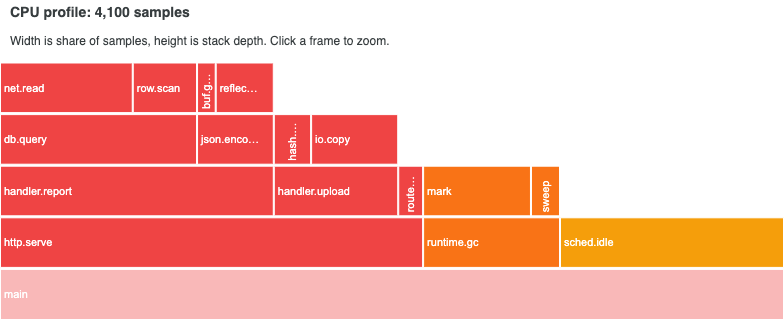
A flame graph is an icicle with two settings changed, and it is the reason this chart type exists in cartesian form. Set direction to 'up' so the stack grows upward from the root frame, and sort to 'name' so siblings are alphabetical.
That second one carries the whole idea. Alphabetical ordering holds a frame in the same place across profiles, so two runs of the same program can be compared by eye. Ordering by size would move every frame between runs and lose exactly that.
plotOptions: {
  icicle: {
    direction: 'up',
    sort: 'name',
    spacing: 1,
    dataLabels: {
      align: 'left',
      minSizeToShow: 44,
    },
  },
}
align: 'left' matters more than it looks: a profiler reader scans the left edge of the stack, where a frame lines up with the one that called it.
Labels on Narrow Cells
A deep tree runs out of room quickly, so the label rules are where most of the tuning happens.
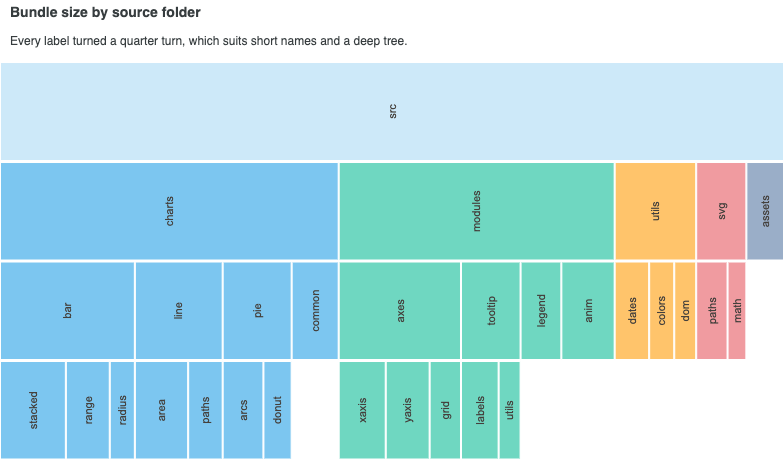
dataLabels.minSizeToShow (default 30) hides the label on any cell shorter than that many pixels along the reading direction, so narrow cells do not overflow. dataLabels.rotate decides whether a label is turned a quarter turn: 'auto' (the default) turns it only on a cell taller than it is wide, where a flat label would be clipped while the value axis still has room. 'always' turns every label for a uniform look, and 'never' keeps them all flat.
A turned label reads across the band thickness rather than along the value axis. That makes 'always' a good fit for short names and a deep tree, and a poor one for wide shallow bands, where it costs you labels that would have fitted flat.
plotOptions: {
  icicle: {
    dataLabels: {
      rotate: 'always',
      minSizeToShow: 14,
      style: { fontSize: '11px' },
    },
  },
}
Click to Zoom
By default, clicking a cell zooms into that branch, with a breadcrumb to walk back out. A click on a cell with nowhere to zoom is ignored. Set plotOptions.icicle.zoomOnClick to false to keep the chart static.
zoomType decides what the zoom actually changes, and it is the partition equivalent of chart.zoom.type:
zoomType | What moves | Use it when |
|---|---|---|
'value' (default) | The value axis only. The branch stretches to fill the plot and every level stays where it was. | You want ancestors to stay on screen as context and the reader to keep their bearings. |
'both' | The value axis and the depth axis. The branch is promoted to the top level and its subtree fills the plot. | The tree is deep and you would rather spend the whole plot on the subtree. |
It is not named 'x' / 'y' because direction swaps which screen axis is which.
Ragged Hierarchies
When a branch bottoms out before the deepest level in the tree, plotOptions.icicle.leaf decides how it is drawn. 'stop' (the default) ends the leaf at its own band and leaves the bands below it empty, so the white space under a branch shows how deep that branch runs. That stepped silhouette is a large part of what makes an icicle readable as a hierarchy. 'extend' stretches the leaf to the far edge instead, which fills the plot and reads more like a treemap.
This default is the opposite of the sunburst's, which uses 'extend' so its outer ring stays solid.
Very Deep Trees
maxDepth caps how many levels are drawn, counting the focused one. It defaults to 'auto', which draws the whole tree and lets the label rules above handle the crowding. Set a number on something genuinely deep, such as a call stack, to keep the top levels readable. Branches cut that way are marked, and clicking one zooms in to reveal them.
levelSize controls band thickness independently: 'equal' (the default) divides the depth axis by the deepest visible level so the tree always fills the plot, while a pixel number or a '%' string keeps its thickness through a zoom, which is what a fixed-height row needs.
From a Drilldown Config
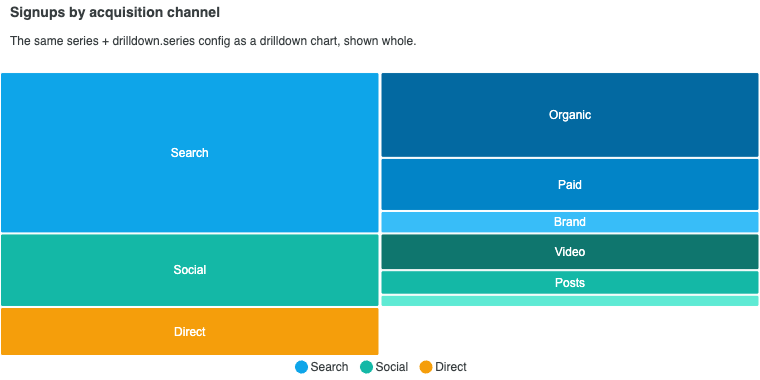
A drilldown chart's data is already a hierarchy: the top-level series plus the drilldown.series entries each point refers to. An icicle reads that same config directly, so an existing drilldown chart becomes an icicle by flipping chart.type, with no change to the data. It reads the config as plain data, so the drilldown feature itself does not need to be loaded.
const chart = new ApexCharts(el, {
  chart: { type: 'icicle' },
  series: [{
    data: [
      { x: 'Search', y: 790, drilldown: 'search' },
      { x: 'Social', y: 360, drilldown: 'social' },
      { x: 'Direct', y: 240 },
    ],
  }],
  drilldown: {
    series: [
      { id: 'search', data: [{ x: 'Organic', y: 430 }, { x: 'Paid', y: 250 }] },
      { id: 'social', data: [{ x: 'Video', y: 210 }, { x: 'Posts', y: 150 }] },
    ],
  },
})
chart.render()
Tree-Shaking
Because the icicle is already a separate entry, the tree-shaken form is the same import written against the core build:
import ApexCharts from 'apexcharts/core'
import 'apexcharts/icicle'
See tree-shaking for what each entry point costs.
Icicle or Sunburst?
They take the same data and support the same zooming, so the choice is about shape rather than capability.
- Icicle when labels matter, when the tree is deep, or when readers need to compare two cells on the same level by length. Straight bands keep a common scale across the whole level.
- Sunburst when the story is part-to-whole and the top levels carry most of the weight. A ring gives the root and its immediate children the most room, and it reads as a single object.
Neither is in the default bundle (the sunburst left it in 8.0), so each takes its own import: apexcharts/icicle or apexcharts/sunburst, or both for a page that offers the two.
When to Use an Icicle Chart
- To show a hierarchy where every level should stay readable at once, rather than one drilldown level at a time.
- For profiling and performance work, where the flame-graph form is the convention readers already know.
- To break down a total that itself breaks down further, when the labels are too long for a radial layout.
More configuration specific to the JavaScript icicle chart can be accessed at this page.