Made with ApexNo. 01ApexCharts
In first class, 203 of 325 were saved. In third class, 178 of 706.
Everyone aboard the Titanic when it struck ice on the night of 14 April 1912, one dot per person, as counted by the British inquiry that summer. Step through to follow them.
Of 2,201 people aboard, 711 were saved. A first-class passenger was about two and a half times as likely to be saved as a third-class one, and 146 of 150 first-class women and children were saved against 103 of 244 in third class.
- Data
- 1912
- Licence
- Public domain (Crown copyright expired)
- Made by
- The ApexCharts team
- Built with
- ApexCharts
How it was made
The piece is one unit chart of 2,201 marks, one for each person the 1912 British inquiry counted aboard, shown in five steps. Each step is a single updateOptions call. The chart draws every mark, moves it and shows its tooltip.
One mark keeps one person
Every person is an object with an id (third-woman-41, never a name), and plotOptions.unit.transition is 'identity'. The chart matches marks between renders by that id, so each dot stays one person through all five steps: from the crowd to a class column, then to the women-and-children half or the men's half, and back into the crowd at the end.
plotOptions: {
  unit: {
    shape: 'pictogram',
    transition: 'identity',
    gather: { motion: 'spring', spring: 'gentle', enter: 'fade' },
  },
},
The spring is the gentle preset, the softer one meant for large reflows, which settles without a visible bounce. A bounce would be the wrong tone for this subject.
Saved and lost do not rely on colour
A saved person is a solid disc and a lost person is a ring. Both are drawn glyphs: each datum carries its own mark, which overrides the chart-wide one the same way fillColor overrides a series colour. The difference survives greyscale and every kind of colour blindness.
const DISC = { path: 'M12 2a10 10 0 1 0 0 20a10 10 0 1 0 0-20Z', viewBox: [0, 0, 24, 24] }
const RING = {
  path: DISC.path + 'm0 5.2a4.8 4.8 0 1 1 0 9.6a4.8 4.8 0 1 1 0-9.6Z', // the hole
  viewBox: [0, 0, 24, 24],
  fillRule: 'evenodd',
}

{ id: p.id, fillColor: p.saved ? IVORY : SLATE, mark: p.saved ? DISC : RING }
viewBox has to be an array of four numbers. The SVG string form, '0 0 24 24', is not read: the glyph falls back to a 100-unit box, so it draws at about a quarter of its size, tucked into the top-left corner of its slot, with no warning.
Columns, not circles
The first version put each class in its own round cluster, saved people at the centre:
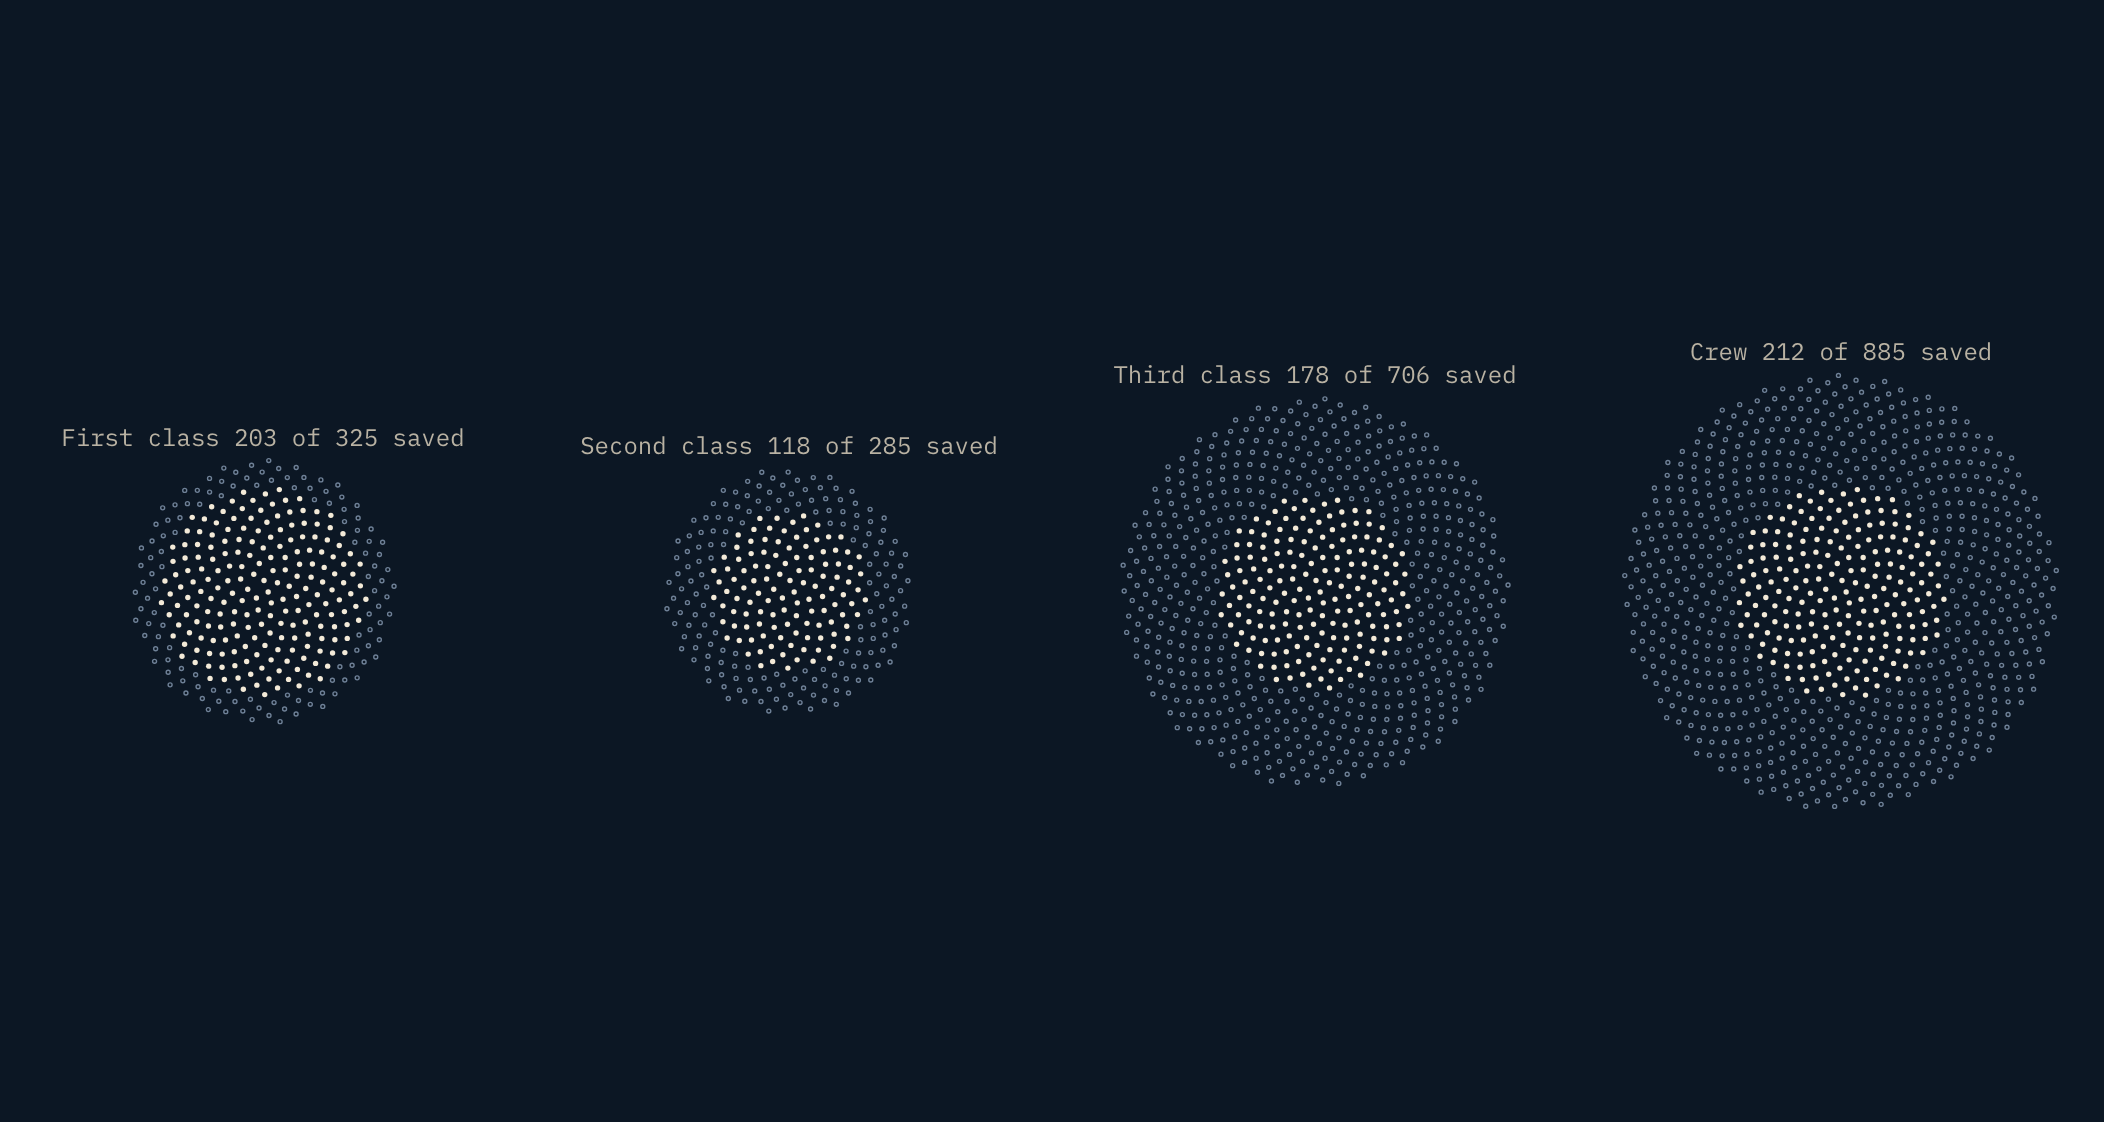
It looks good, but only its labels answer the question; the picture does not. The eye cannot compare the share of a circle's area that is solid, and the clusters had to shrink every mark to fit four in a row. The columns layout turns the same marks into stacked bars of people. Sorting each group saved-first fills each column from the bottom, so the saved share reads as a height you can compare across classes.
Every number is computed
Every figure in the captions, labels and the note on the chart is computed from the inquiry's table, which sits at the top of the script as fourteen rows (TABLE). The headline is checked the same way: the piece computes it and reports any difference from the text it shipped with, and the site's build checks this page's headline against the piece's. "About 2.5 times" is first class's saved rate over third class's, rounded once. Even which group the note points at is computed: it is whichever was saved least often.
The table is transcribed from the report's "Numbers Saved" section and checked against the Project Gutenberg edition of the same report. The table gives the number saved in each group, out of how many and as a percentage, but no number lost, so each lost figure here is a subtraction; together they match the report's own total of 1,490 lives lost. It counts the crew by department and notes 23 women among them, so the crew men's row (862 aboard, 192 saved) is the remainder. It splits children by sex but never says what age made a child, so the piece does not either.
What is hand-written
Everything around the chart is ordinary HTML and CSS: the step buttons and arrows, the captions, the Saved and Lost key (the chart's own legend is off), the bracket under each half in step 4, the note on the second-class men's column, the label row on narrow screens, the tooltip's restyling, and one CSS rule for the rings.
The note is placed from the page itself. Once a step starts, the piece reads the column's box each frame until it stops moving, then sets the note at its top, so it lands where the column is at any size. Below 900px the chart's one-line column labels would collide, so they are turned off and a CSS grid of the same count sits under the columns instead.
The ring rule: a drawn glyph is hit-tested on its ink, so the pointer fell through the hole of a ring and the tooltip flickered between people. An invisible stroke as wide as the hole fills it for the pointer. A stroke runs along every edge of the path, the outer one too, so it is clipped back to the ring's own circle and never reaches a neighbour:
#chart path[fill-rule='evenodd'] {
  stroke: transparent;
  stroke-width: 9.6; /* the hole's diameter, in the glyph's 24-unit box */
  pointer-events: all;
  clip-path: circle(50%) fill-box; /* the ring's outline */
}
The stepper is the only keyboard model: the chart's own keyboard navigation and announcements are off, and at each step the chart's accessible description is set to the figures it shows.
Get the code
The piece is one HTML file with its data inside it, loading ApexCharts from a CDN. Save it and open it in a browser, or take it apart.
The unit chart is a premium ApexCharts feature: add your licence key where the file marks the spot. Without one it runs in trial mode, with a small watermark.