Made with ApexNo. 04ApexMaps
46 of Japan's 47 prefectures got smaller.
2020年と2025年の国勢調査を比べると、人口が増えたのは47都道府県のうち東京都の1都だけ。
The percentage change in each prefecture's population between the censuses of October 2020 and October 2025, from the final count. Prefectures in ink blue shrank, the darker the steeper the fall; Tokyo, in vermilion, is the only one that grew. Step through, or switch between the map and one hex per prefecture.
Between the censuses of 2020 and 2025 Japan's population fell by 3,173,571, or 2.52%, and 46 of its 47 prefectures shrank. Only Tokyo grew, by 189,029 people or 1.35%. Akita fell furthest, by 8.13%, and Okinawa came closest to growing, 932 people down; the preliminary count had shown it growing.
- Data
- 1 October 2020 and 1 October 2025 (final count, published 29 September 2026)
- Licence
- Census tables on e-Stat under the Government of Japan Standard Terms of Use 2.0 (compatible with CC BY 4.0); created by ApexCharts from the census, with the percentage changes calculated by ApexCharts from the published counts. Map: Natural Earth, public domain
- Made by
- The ApexCharts team
- Built with
- ApexMaps
How it was made
The piece is one ApexMaps choropleth of Japan's 47 prefectures, coloured by how much each one's population changed between the censuses of 1 October 2020 and 1 October 2025. It has four steps, and a switch that redraws the same map as one hexagon per prefecture. Each step is one updateOptions call and a setSelection; the map draws every region, cell, label, note and tooltip.
The final count, not the first one
The figures are the 2025 census's final count, the Basic Complete Tabulation published on 29 September 2026, Table 1-1. The bureau measures each five-year change against the 2020 population recompiled to the 2025 municipal boundaries, and so does the piece. For Tokyo and Kanagawa that base differs by four people from the 2020 census as first published, after a boundary change between Machida and Sagamihara, and the footnote says so.
The preliminary count, published in May 2026, had Okinawa growing by 740 people and so 45 prefectures shrinking. The final count has Okinawa 932 down. Reports written from the preliminary release are still online, which is why the fourth step is about Okinawa and why the footer names the count it uses. Every number in the piece's captions, notes, legend, tooltips and footer, and its headline, is computed from the 47 rows at the top of its script; the piece checks its headline against them, and the site's build checks this page's headline and Japanese line against the piece's.
Round breaks, and one at zero
The finding is a sign, not a size: 46 negatives and one positive. So the scale is a threshold scale with its breaks given, and 0 among them, so that the colour turns exactly at 0.0%:
scale: {
  type: 'threshold',
  breaks: [-6, -4, -2, 0],
  palette: ['#1f3d63', '#4d7098', '#8aa4bd', '#c3d1de', '#c0391f'],
}
The falls are cut in steps of two points, which a reader can hold in their head, and the classes hold 11, 18, 9 and 8 prefectures, with 1 above zero; the legend prints each count through legend.formatter. The national fall, 2.52%, sits in the −4 to −2% class. The library's own classes for signed data are quantiles broken at zero, which here fall at about −5.8, −4.4 and −3.4: honest, but numbers that mean little to a reader.
The shrinking prefectures are ink blues, darker for a steeper fall. The one that grew is vermilion, the colour of a seal's ink, and the only warm colour on the map. Colour is not the only cue, and in greyscale the vermilion comes out close to the second blue: on the honeycomb Tokyo's cell carries an ink ring on every step and on the card's still, a note names it, and every tooltip gives a signed percentage with a true minus.
One hex per prefecture
Tokyo covers little of the map, so there the only growing prefecture is a speck. The switch sets geo.layout to 'hex' or back to null, and the map walks each prefecture between its outline and its cell. On the honeycomb every prefecture weighs the same, which is what makes 46 against 1 legible. The first two steps are that comparison, the map and then the honeycomb, so there the switch moves to the step that draws the view it names; on the later steps it redraws the same step, notes and highlight included.
The geography uses a conic equal-area projection and a geo.view.fit box that takes in Okinawa. Both stay in the options across the switch: since ApexMaps 1.4.0 a hex layout keeps its own plane and framing, and a switch returns the camera to the new view's fit. The box leaves out Minamitorishima, part of Tokyo, far to the south-east, and the footer says so.
The rejected version
The first version asked for a continuous scale, scale: { type: 'linear' }, and left the palette to the library, which on signed data picks a diverging ramp anchored at zero:
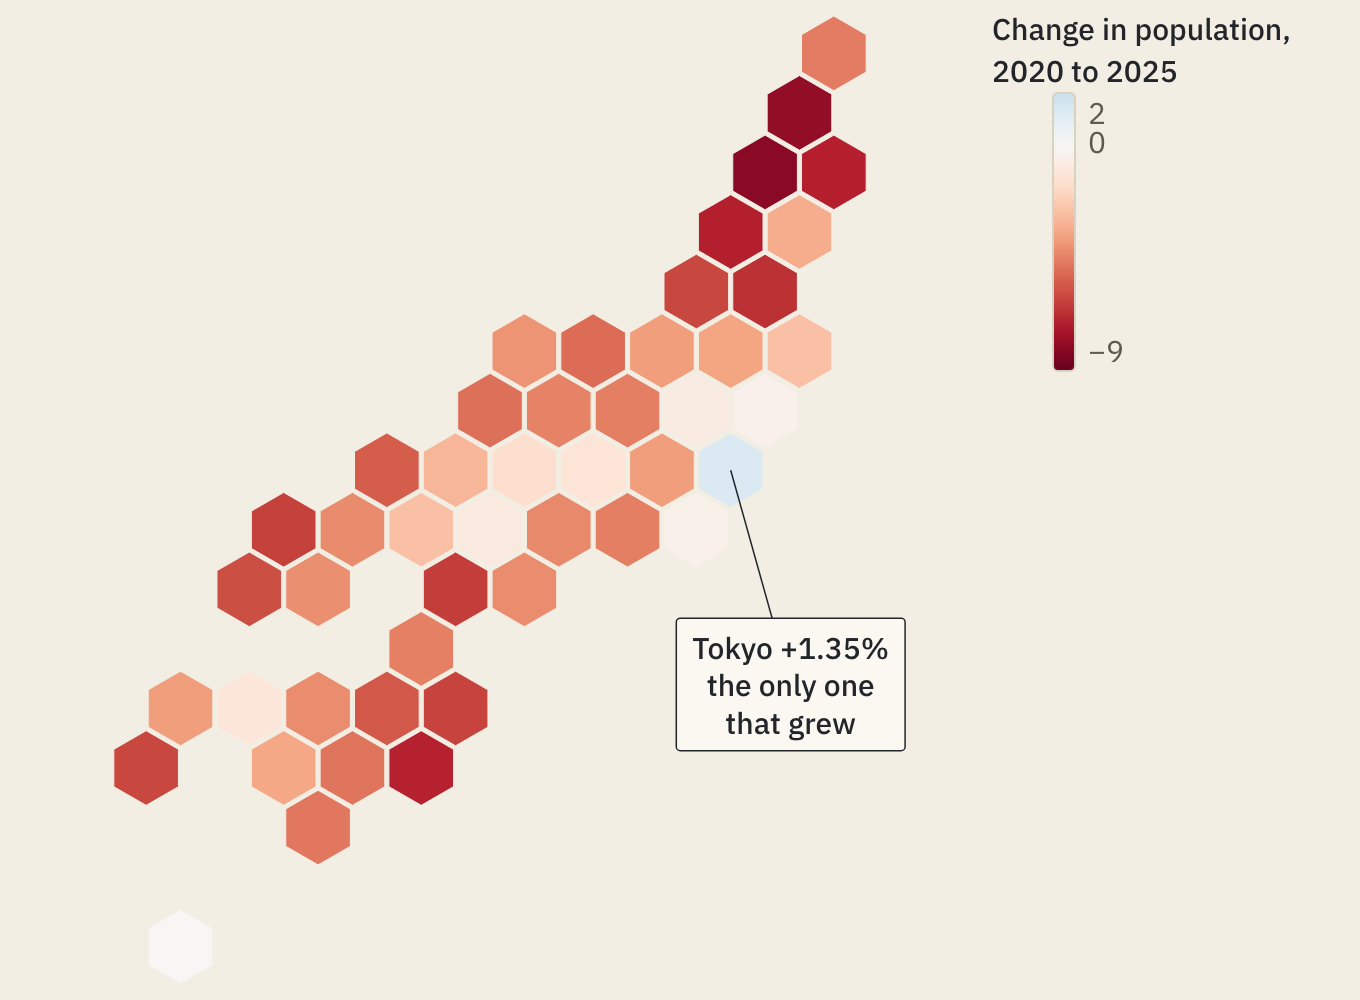
It is correct, and it buries the story. Equal magnitudes get equal intensity, so Tokyo's +1.35% is drawn a pale blue barely off the paper, while losses as small as Okinawa's turn white. The one prefecture the headline is about becomes the hardest to see, and red for decline reads as alarm. The explicit classes give growth a colour of its own, whatever its size.
Labels in kanji
The honeycomb is labelled in kanji, through dataLabels with a formatter that looks each key up, and style.fontFamily set to Shippori Mincho. The legend, the notes and the tooltip's figures stay in the sans; the tooltip sets the kanji name in the Mincho too.
dataLabels: {
  enabled: true,
  formatter: ({ key }) => BY_KEY[key].label, // '秋田' for JP-05
  minFeatureArea: 0,
  style: { fontFamily: '"Shippori Mincho", serif', fontSize: 14, fontWeight: 600 },
}
No colour is set, so each label takes whichever of the theme's ink and paper reads on its cell: paper on the two darker blues and on Tokyo's vermilion, ink on the paler blues. The vermilion is dark enough for paper-coloured kanji to keep a 5.2:1 contrast. The size follows the cell, which is about 7% of the map's width: 14px where three kanji fit, down to 12px on a narrower map. Below a map about 560px wide the honeycomb drops them and the colour has the cell, and the card's still has none, where they would print as specks. The geography has no labels: many prefectures are too small to hold a name.
Notes, tooltips and the highlight
The notes are feature annotations, each pointing at its prefecture with a connector and saying on a second line why it is marked, set in the sans with the label's own fontFamily. ApexMaps does not move a note back inside the map, so each is placed by hand in the sea, and checked to stay inside the map at every width from 320 to 1440px. Below a 560px map each note is a number, and a key under the map gives its words. Tokyo's ring is a feature annotation too, with an outline and no label.
The tooltips come from tooltip.formatter: the bureau's English name, the Japanese name, the change and both counts. The third and fourth steps highlight the prefectures they talk about with setSelection, which dims the rest to states.muted; a click on the map does not change the selection, and zoom and pan are off. Each step writes its caption into the map's a11y.description, and with reduced motion the morph is a swap. Arrowing through the prefectures, the keyboard hears what the tooltip shows, written by a11y.announcementFormatter with the sign in words: "Akita, down 8.13%: 881,470 people, from 959,502 in 2020".
What building it fixed
The piece needed ApexMaps 1.4.0 and apexmaps-geo 1.1.1, both released while it was built, to fix what building it found. The 10m Japan pack drew the Amami Islands as part of Okinawa, and Nagashima and Shishijima as part of Kumamoto; they belong to Kagoshima. The automatic diverging ramp said it was anchored at zero and was not. A hex view inherited the geography's projection and fit box, which flipped and misframed the grid. And labels counted a kanji as a little over half an em wide, so collision checks passed labels that overlapped.
ApexMaps 1.5.0 followed, for three things the first version had to work around. Every map claimed every touch gesture, so a finger on this one, which neither zooms nor pans, could not scroll the page past it. The keyboard announced the geometry's names and a bare number whatever the tooltip said, with no way to change it. And labels were drawn in one colour, so the first version gave every kanji a paper-coloured halo to read on the dark blues. Now the map leaves the page its gestures, the announcement can be written, and each label picks its own ink.
The piece pins both: the library by its script tag, and the geometry with ApexMaps.setGeoSource pointed at apexmaps-geo 1.1.1, so the map the footer credits is the map that loads.
What is hand-written
The step buttons and arrows, the captions, the Geography and hex switch, the phone's numbered key and the footer are ordinary HTML and CSS. The script reserves, at each width, the height of the tallest caption, phone key and touch readout, so stepping never changes the piece's height, and it queues each updateOptions call behind the last, so a quick reader cannot start a morph while the previous one is being set up. It also picks the label size from the map's width.
On a touch screen a tooltip lasts only while the finger is down, so there a tap writes the same figures into a line under the map, from the map's featureClick event, which fires even with click selection off.
The map's tooltip, legend, chips and borders are styled through its theme tokens and a few rules on its own classes: the legend is set as a table of three or two columns where its five classes do not fit one row, and Tokyo's ring is hidden while the shapes are in flight, as the notes are.
The hex layout and the annotations are licensed features; the piece sets the site's key, and the download leaves a place for yours.
Get the code
The piece is one HTML file with its data inside it, loading ApexMaps from a CDN. Save it and open it in a browser, or take it apart.
The hex layout and the annotations are premium ApexMaps features: add your licence key where the file marks the spot. Without one they run in trial mode, with a small watermark.