Other projects

What is ApexCharts?

ApexCharts is a modern charting library that helps developers to create beautiful and interactive visualizations for web pages.

It is an open-source project licensed under MIT and is free to use in commercial applications.

DOWNLOAD VIEW DEMO

Built for developers

Integrating visualizations with ApexCharts is as simple as it can get with extensive API docs and 100+ samples ready to be used.

GET STARTED

let myChart = new ApexCharts(element, {
  chart: {
    type: 'bar',
  },
  series: [{
    data: [18, 28, 47, 57, 77]
  }],
  yaxis: {
    opposite: true,
  }
})
myChart.render();

Several Chart Types

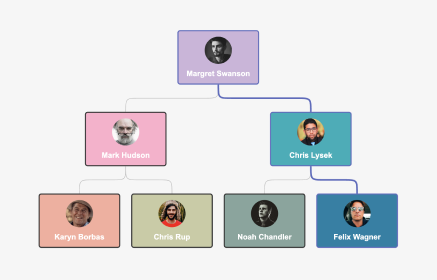
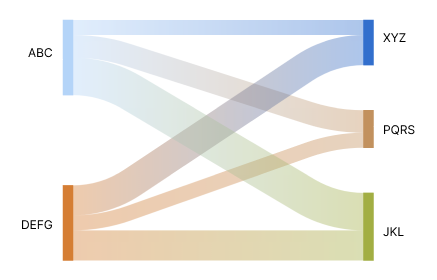
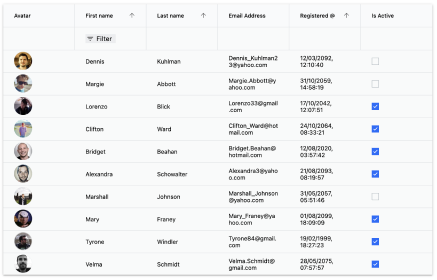
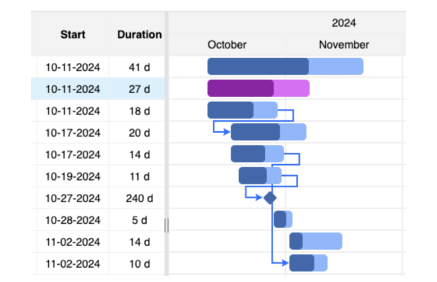
Choose from a wide range of charts. Create a combination of different charts to provide a clear difference between data.

Fully Responsive

ApexCharts are flexible and responsive - making your charts work on desktops, tablets as well as mobiles.

Highly Customizable

Configuring ApexCharts is easy-peasy. Our comprehensive docs will help you setting up your charts quickly.

Free & Open Source

ApexCharts.js is an open source project licensed under MIT and is free to use in commercial applications.

See it in action

Below is a code snippet to show a glimpse of how easy it is to create interactive charts.
Dashboard Templates

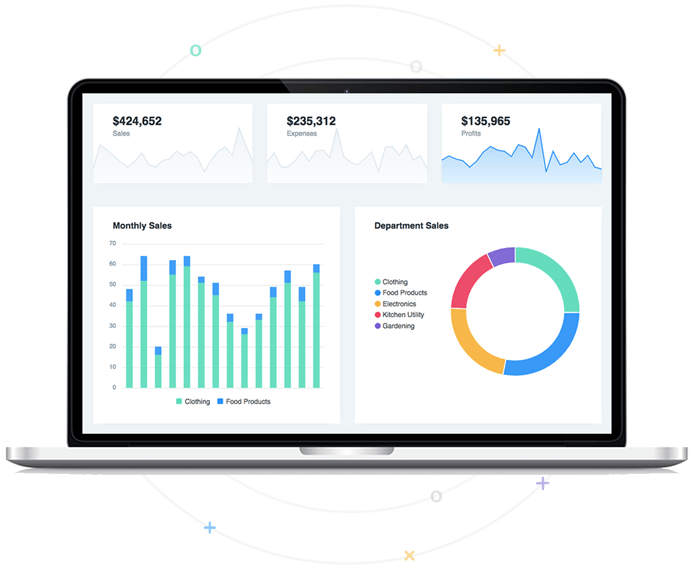
Dashboard is the face of any application and should speak an expressive language.
We have developed dashboard templates for you to have a look at the possibilities of ApexCharts.

Dashboard

Stay Updated

Get the latest news, updates and what's coming next! Sign up for our Newsletter here.

Thank You! You are signed up.

There was an error while trying to send your request. Please try again.

ApexCharts.js will use the information you provide on this form to be in touch with you and to provide updates and marketing.