Chart Demos > Scatter Charts
Scatter Charts
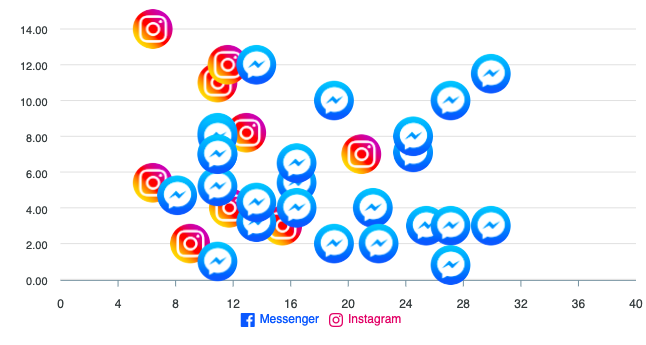
For non-linearly related variables, JavaScript Scatter Charts are quite useful when there is a need to graphically establish a relationship between the variables. They are sometimes referred to as correlation plots because they are used to show how two variables are correlated. In ApexCharts, you can plot category or numeric values on a scatter chart and also draw a time-series scatter chart. Zooming in/out of the scatter plots creates an appealing visual on screen.
Few examples below illustrates the creation of Scatter Plots using ApexCharts.


Please wait...