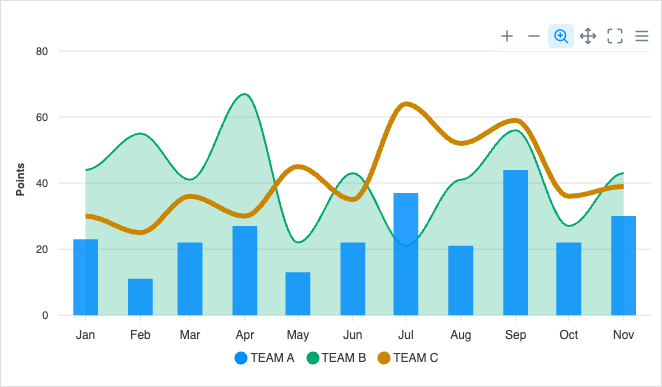
Mixed Charts

A JavaScript Mixed Chart or a Combo Chart is a visualization that allows the combination of two or more distinct graphs. The features of each chart are retained on the mixed chart plot. Different scales of measure are present on the mixed chart and with this; it is an ideal plot for presenting data values that are usually difficult to combine because of the significant difference in value ranges. Generally, a combo chart makes it possible to view the relationship, differences, deviations, and anomalies between a different set of data by bringing them on a single plot.

Below, you will find a combination of line, area and column chart examples.

Stay Updated

Get the latest news, updates and what's coming next! Sign up for our Newsletter here.

Thank You! You are signed up.

There was an error while trying to send your request. Please try again.

ApexCharts.js will use the information you provide on this form to be in touch with you and to provide updates and marketing.