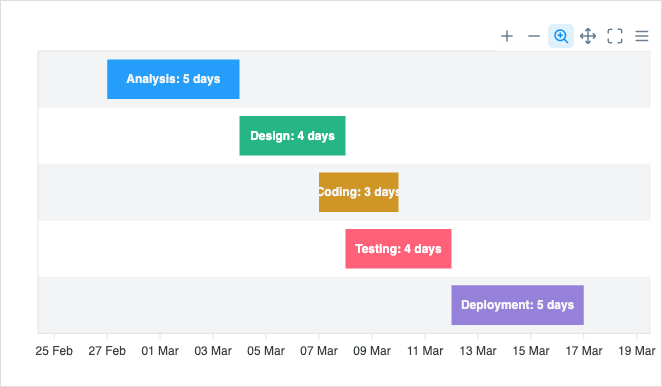
JavaScript Timeline / Range Bar
Browse JavaScript timeline / range bar examples built with ApexCharts.js. Click on any example below to see the live chart and source code.
Browse JavaScript timeline / range bar examples built with ApexCharts.js. Click on any example below to see the live chart and source code.