React Charts
Using ApexCharts to create charts in React.js
React-ApexCharts is a wrapper component for ApexCharts ready to be integrated into your react.js application to create stunning React Charts. In this post, you will learn how to use React-ApexCharts component to create various charts in your react.js application with ease.Install
Install the React-ApexCharts component in your React application from npm
npm install --save react-apexcharts apexcharts
<script src="https://cdn.jsdelivr.net/npm/apexcharts"></script>
<script src="https://cdn.jsdelivr.net/npm/react-apexcharts"></script>
Props
Here are the basic props you can pass to the the React-ApexCharts component| Prop | Description | Type | Default |
| type | The chart type which is a mandatory prop to specify | String | ‘line’ |
| series | The data which you want to display in the chart | Array | undefined |
| width | Width of the chart | String || Number | ‘100%’ |
| height | Height of the chart | String || Number | ‘auto’ |
| options | All the optional configuration of the chart goes in this property | Object | {} |
Usage
Once you have installed the library, you are ready to create a basic bar chart in react.js. So, let’s get started.
import React, { Component } from "react";
import Chart from "react-apexcharts";

class App extends Component {
  constructor(props) {
    super(props);

    this.state = {
      options: {
        chart: {
          id: "basic-bar"
        },
        xaxis: {
          categories: [1991, 1992, 1993, 1994, 1995, 1996, 1997, 1998, 1999]
        }
      },
      series: [
        {
          name: "series-1",
          data: [30, 40, 45, 50, 49, 60, 70, 91]
        }
      ]
    };
  }

  render() {
    return (
      <div className="app">
        <div className="row">
          <div className="mixed-chart">
            <Chart
              options={this.state.options}
              series={this.state.series}
              type="bar"
              width="500"
            />
          </div>
        </div>
      </div>
    );
  }
}

export default App;
import React, { Component } from "react";
import Chart from "react-apexcharts";

class App extends Component {
  constructor(props) {
    super(props);

    this.state = {
      options: {
        chart: {
          id: "basic-bar"
        },
        xaxis: {
          categories: [1991, 1992, 1993, 1994, 1995, 1996, 1997, 1998]
        }
      },
      series: [
        {
          name: "series-1",
          data: [30, 40, 45, 50, 49, 60, 70, 91]
        }
      ]
    };
  }

  render() {
    return (
      <div className="app">
        <div className="row">
          <div className="mixed-chart">
            <Chart
              options={this.state.options}
              series={this.state.series}
              type="bar"
              width="500"
            />
          </div>
        </div>
      </div>
    );
  }
}

export default App;
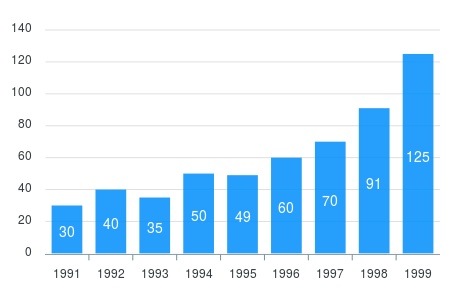 Next, we create a simple line chart. To do so, just change the
 type property in the component props
Line Chart
  <Chart
    options={this.state.options}
    series={this.state.series}
    type="line"
    width="500"
  />
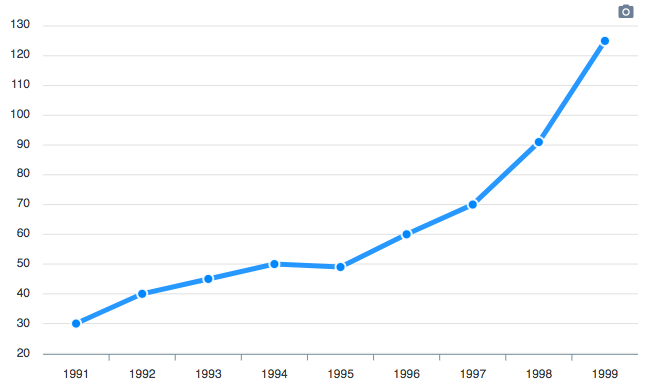 To read more about the options you can configure in a line chart, check out this plotOptions.line configuration.
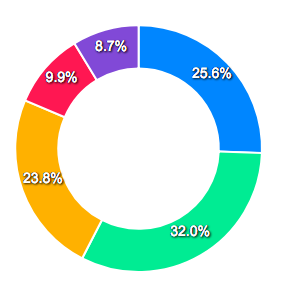
Now, we will create a donut chart with minimal configuration. To do so, change some of the options
To read more about the options you can configure in a line chart, check out this plotOptions.line configuration.
Now, we will create a donut chart with minimal configuration. To do so, change some of the options
Donut Chart
The donut chart accepts a single dimensional series array unlike other chart types. Try the below code.
import React, { Component } from 'react';
import Chart from 'react-apexcharts'

class Donut extends Component {

  constructor(props) {
    super(props);

    this.state = {
      options: {},
      series: [44, 55, 41, 17, 15],
      labels: ['A', 'B', 'C', 'D', 'E']
    }
  }

  render() {

    return (
      <div className="donut">
        <Chart options={this.state.options} series={this.state.series} type="donut" width="380" />
      </div>
    );
  }
}

export default Donut;
 In the next section, we will see how we can update the rendered chart dynamically
Updating React Chart Data
Updating your React chart data is simple. You just have to update the series prop and it will automatically trigger event to update the chart. We will see an example below updating the chart data with some random series to illustrate the point.
const newSeries = [];

this.state.series.map((s) => {
  const data = s.data.map(() => {
    return Math.floor(Math.random() * (180 - min + 1)) + min
  })
  newSeries.push({ data, name: s.name })
})

this.setState({
  series: newSeries
})
More Charts Examples?
There are several other charts which can be created by changing a couple of options. The major configuration has to be done in theoptions property of ApexCharts component and rest will fall into places.
Need Advanced Chart Features?
We have partnered with Infragistics to grant you access to an extensive library of data visualizations that enables stunning and interactive React charts for your web and mobile apps. The comprehensive React charts deliver customizable features like animations, highlighting, annotations, drill-down, multiple layers, tooltips, and lots more. All with an intuitive API, flexible theming and branding, and minimal code to get started!
We know that your React charts shouldn’t just deliver fast performance. They should include all the functionalities your users need, providing UX that keeps the app ahead of your competition. With Ignite UI for React charts, you are empowered to create expressive dashboards, apply deep analytics, and render millions of data points in a matter of seconds. Browse through 65+ customizable React chart types and see which one best fits your project. Included are common business charts like Pie charts, Line, Column, Area, and the most asked for Financial charts.