Zooming in Category X-axis
Until version 3.15.0, zooming was not available on the category x-axis. Only the datetime and numeric axis supported the zooming functionality. Since 3.15.0, you can enable zooming on the category x-axis.
On a bar chart, even if you enable chart.zoom.enabled: true, you will see it doesn't activate the zoom toolbar. Zooming, by default, is disabled on a category bar chart. If you take a closer look at the ticks on a bar chart v/s line chart, you will notice there is a difference in how the ticks are placed.
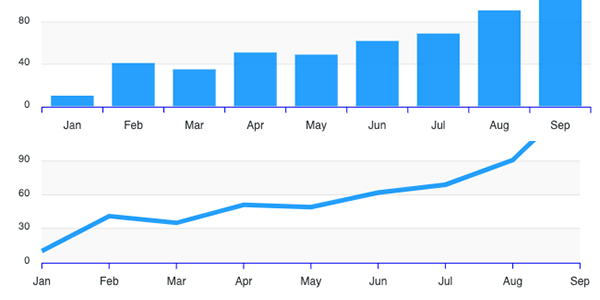
On the column chart, tickPlacement is "between" the labels, while on the line chart, tickPlacement is "on" the labels. If the tickPlacement is set to between, the category chart's zooming is disabled.
Change the xaxis.tickPlacement
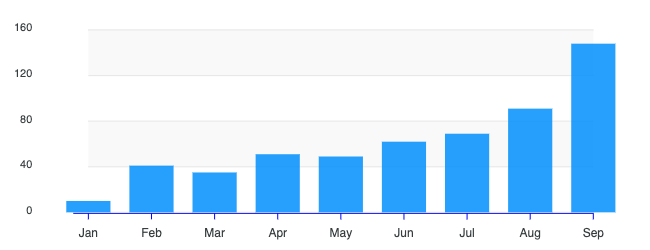
Once we change the xaxis.tickPlacement to 'on' in bar charts, we will see a visual like below.
xaxis: {
  categories: ['ABC', 'PQR', 'XYZ'],
  tickPlacement: 'on'
}
Setting the tickPlacement: 'on' will automcatically activate the zoom toolbar.
Toggle the zooming controls
A chart's zoom functionality can be enabled/disabled by setting the chart.zoom property.
chart: {
  zoom: {
    enabled: true
  }
}
Troubleshooting common issues
My bars are cropped after enabling zooming on bar charts
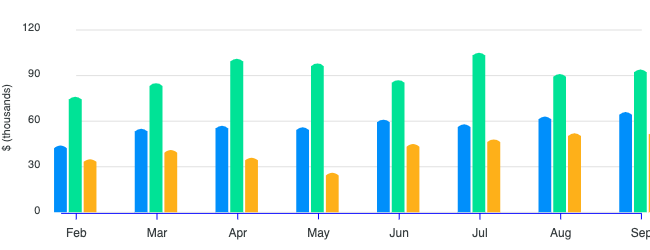
If you see that your bars are cropped after enabling zooming on category bar charts, you may need to manually set the padding options as automatic padding failed to calculate the needed space accurately.
In such a case, you may try this
grid: {
  padding: {
    left: 30, // or whatever value that works
    right: 30 // or whatever value that works
  }
}
There is a lot of space on the left or right
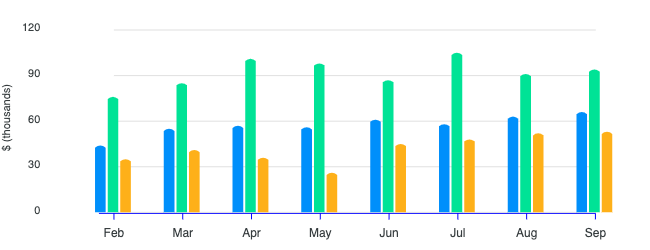
Again, there might be some extra padding in category bar charts after you enabled zooming. You may give it negative padding to the same grid.padding properties described above.
Examples
You can take a look at the full code sample on the Zoom enabled Category Bar chart.