chart.zoom
Configuration Structure
chart: {}The zoom options let users zoom into axis charts by dragging a selection, scrolling the mouse wheel, or using the toolbar buttons. You can restrict zooming to a single axis, auto-scale the y-axis to the visible range, and style the highlighted zoomed area. It is part of the chart configuration.
zoom
enabled
To allow zooming in axis charts.
Note: In a category x-axis chart, to enable zooming, you will also need to set xaxis.tickPlacement: 'on'.
Read more on the Category Axis Zoom tutorial.
type
Allow zooming either on both x-axis, y-axis or on both axis. Available options
- x
- y
- xy
Known Issue: In synchronized charts, xy or y will not update charts in sync, while x will work correctly.
autoScaleYaxis
When this option is turned on, the chart's y-axis re-scales to a new low and high based on the visible area. Helpful in situations where the user zoomed in to a small area to get a better view.
Known Issue: This option doesn't work in a multi-axis chart (when you have more than 1 y-axis)
allowMouseWheelZoom
Whether to allow zooming using mouse wheel.
pinch
Momentum: enable two-finger pinch-zoom on touch devices. It zooms the x-axis around the pinch centroid, frame by frame, and requires zoom.enabled: true. This is on by default; set false to opt out. See the Mobile gestures guide.
zoomedArea
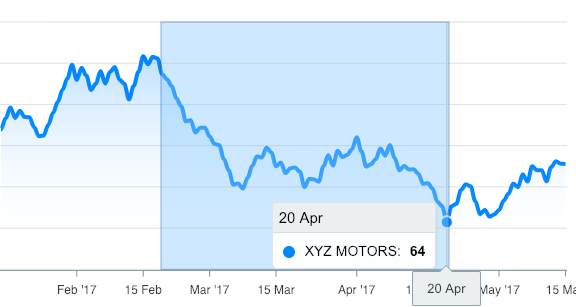
zoomedArea is the area which is drawn when a user drags the mouse from one point to another
fill
color
Background color of the selection zoomed area
opacity
Sets the transparency level of the selection fill
stroke
color
Border color of the selection zoomed area
opacity
Sets the transparency level of the selection border
width
Sets the width selection border