Legend
When there are multiple dataSeries in the chart, legends help to identify each dataSeries with a predefined symbol and name of the series.
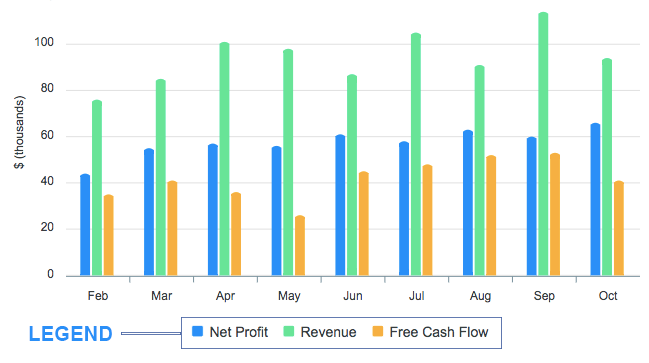
Show/Hide Legend
legend: {
  show: false
}
Change Legend Position
There are pre-defined positions for the legend to be placed. You can place the legends at the following places
- top
- right
- bottom
- left
Legend positioned to top:
legend: {
  position: 'top'
}
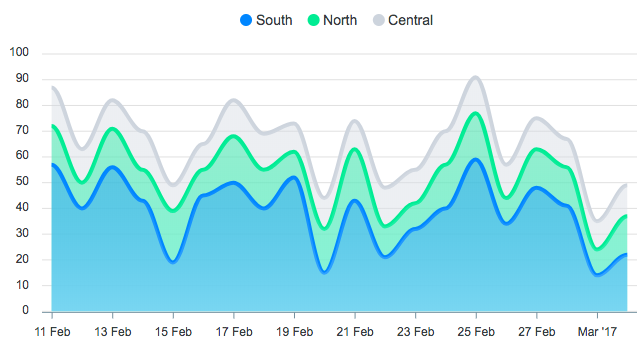
Legend Alignment
Aligning legend horizontally
Horizontally, you can align the legend using the following values:
- center
- left
- right
Legend aligned to right horizontally:
legend: {
  horizontalAlign: 'right'
}
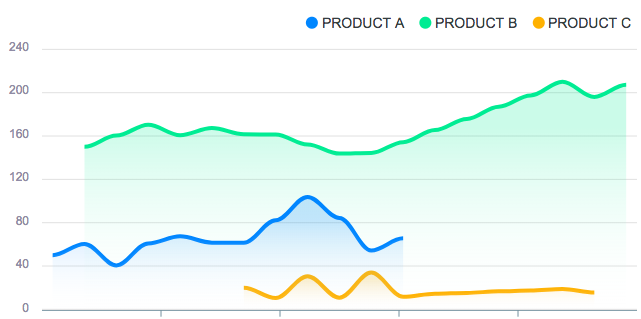
Show Legend for a Single-Series Chart
By default, ApexCharts hides the legend when there is only one series. Set showForSingleSeries: true to display it anyway:
legend: {
  showForSingleSeries: true  // default is false
}
Custom Legend Formatter
Use the formatter function to control the label text next to each legend marker. The function receives the series name and an opts object that exposes the full chart state:
legend: {
  formatter: function(seriesName, opts) {
    // opts.w.globals.series[opts.seriesIndex] is the raw series data array
    const total = opts.w.globals.series[opts.seriesIndex].reduce(function(a, b) {
      return a + b
    }, 0)
    return seriesName + ' (total: ' + total + ')'
  }
}
Interactivity with Legend
Enable show/hide a series when it is clicked
When a user clicks a legend, the series associated with that legend is toggled in appearance.
legend: {
  onItemClick: {
    toggleDataSeries: true
  }
}
Highlighting a series when legend is hovered
When a user hovers over a legend item, the series associated with that legend is highlighted and all other series are grayed out.
legend: {
  onItemHover: {
    highlightDataSeries: true
  }
}
Hiding and Showing a Series Programmatically
You can control series visibility from code without requiring a user to click the legend. These methods are available on the chart instance returned by new ApexCharts():
// Hide a series by name (same effect as clicking its legend item)
chart.hideSeries('Revenue')

// Show a hidden series
chart.showSeries('Revenue')

// Toggle visibility (hide if visible, show if hidden)
chart.toggleSeries('Revenue')
Responding to Legend Clicks
Use the legendClick chart event to run code whenever a user clicks a legend item:
chart: {
  events: {
    legendClick: function(chartContext, seriesIndex, config) {
      // seriesIndex: 0-based index of the clicked legend item
      // config.config.series[seriesIndex].name: the series name
      console.log('Legend clicked:', config.config.series[seriesIndex].name)
    }
  }
}
To set global options for the legend, define them in Apex.legend.
For more information on Legends, please refer to Legend configuration