chart.toolbar
Configuration Structure
chart: {}


The toolbar is the menu shown in the top-right corner of a chart. These options control whether it appears, which tools it offers (download, zoom, zoom-in/out, pan, reset, selection, and the measure ruler), and how the chart exports to SVG, PNG, and CSV. It is part of the chart configuration.
toolbar
show
Display the toolbar / menu in the top right corner.
offsetX
Sets the left offset of the toolbar.
offsetY
Sets the top offset of the toolbar.
tools
Clicking an already-selected interaction tool (zoom, pan, selection, or measure) now deselects it and leaves the chart with no active tool, so you can drop back to a plain, gesture-free chart. Previously those buttons were one-way.
download

Show the download menu / hamburger icon in the toolbar. If you want to display a custom icon instead of hamburger icon, you can provide HTML string in this property.
download: true
/* OR */
download: '<img src="/static/icons/download.png" class="ico-download" width="20">'
ApexCharts has built-in support to allow exporting the chart to popular image formats like PNG or SVG and also allows exporting the chart data to a CSV file.
By default, all XY charts have the toolbar enabled in them which has a hamburger icon at the top right corner. Clicking the hamburger icon opens a menu which has following options to download
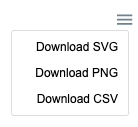
- Export to SVG
- Export to PNG
- Export to CSV creates a comma separated values file, which consists of chart data.
selection
Show the rectangle selection icon in the toolbar. If you want to display a custom icon for selection, you can provide HTML string in this property.
Make sure to also enable chart.selection when showing the selection tool.
chart: {
  selection: {
    enabled: true
  }
}
zoom
Show the zoom icon which is used for zooming by dragging selection on the chart area. If you want to display a custom icon for zoom, you can provide HTML string in this property.
zoomin
Show the zoom-in icon which zooms in 50% from the visible chart area. If you want to display a custom icon for zoom-in, you can provide HTML string in this property.
zoomout
Show the zoom-out icon which zooms out 50% from the visible chart area. If you want to display a custom icon for zoom-out, you can provide HTML string in this property.
pan
Show the panning icon in the toolbar.
reset
Reset the chart data to it's initial state after zommin/zoomout/panning. If you want to display a custom icon for reset, you can provide HTML string in this property.
measure
Show the measure ruler tool, which arms the drag-to-measure ruler with a click instead of holding the measure key. The button appears only when chart.measure.enabled is true. Pass an HTML string to display a custom icon. Selecting it is mutually exclusive with zoom, pan, and selection.
customIcons
Allows to add additional icon buttons in the toolbar. In the below example, index should be used to place at a particular position in the toolbar.
customIcons: [{
icon: '<img src="/static/icons/chart-carpet.png" width="20">',
index: 4,
title: 'tooltip of the icon',
class: 'custom-icon',
click: function (chart, options, e) {
  console.log("clicked custom-icon")
}
}]
export
scale
Scale the exported image. Example: scale: 0.5 or scale: 2
width
Provide a fixed width of the exported image. Don't append unit to the number, just provide a numeric value, it will be considered in px.
csv
filename
Name of the csv file. Defaults to auto generated chart ID
columnDelimiter
Delimeter to separate data-items. Defaults to comma.
headerCategory
Column Title of X values
headerValue
Column Title of Y values
categoryFormatter
Format the x values when exporting to CSV.
valueFormatter
Format the y values when exporting to CSV.
svg

filename

Name of the SVG file. Defaults to auto generated chart ID
png

filename

Name of the PNG file. Defaults to auto generated chart ID
autoSelected
Automatically select one of the following tools when the chart loads.
- zoom
- selection
- pan
- measure
'measure' arms the measure ruler so the plot loads ready to drag with no key held; it requires chart.measure.enabled.