Angular Charts
Using ApexCharts in Angular
ng-ApexCharts is the official Angular wrapper for ApexCharts. It is built for modern Angular: standalone components, signal inputs, and zoneless change detection. There are no NgModules to register and no decorators in the public API.
In this guide you will create your first Angular chart, update it reactively, and call chart methods.
Download and Installation
ng add ng-apexcharts
This installs a compatible apexcharts release alongside the wrapper. If you prefer to do it by hand:
npm install apexcharts ng-apexcharts --save
Version compatibility
| ng-apexcharts | Angular | ApexCharts |
|---|---|---|
| 3.x | 20+ | 6.x |
| 2.5.x | 20+ | 5.x or 6.x |
ng-apexcharts 3.x re-exports all option types (ApexChart, ApexPlotOptions, and the rest) directly from the installed apexcharts package, so the types always match the ApexCharts version you run. The full history is in the compatibility table on GitHub.
There is nothing to add to angular.json and nothing to register in your application config. The chart components load the ApexCharts bundle themselves through a dynamic import(), so no global script tag is required.
Upgrading? If an older version of
ng addaddednode_modules/apexcharts/dist/apexcharts.min.jsto thescriptsarray in yourangular.json, remove it. It is redundant, adds roughly 940 KB to every build, and prevents the tree-shakeable<apx-chart-core>entry point from reducing your bundle. Re-runningng add ng-apexchartsremoves it for you.
Usage
Import ChartComponent into whichever component renders the chart, then use <apx-chart> in its template:
import { Component } from "@angular/core";
import { ChartComponent } from "ng-apexcharts";

@Component({
  selector: "app-basic-chart",
  imports: [ChartComponent],
  template: `<apx-chart [series]="series" [chart]="chart" />`,
})
export class BasicChartComponent {
  readonly chart = { type: "line" as const, height: 350 };
  readonly series = [{ name: "Revenue", data: [10, 41, 35, 51] }];
}
You need at least series and chart for a meaningful chart. Every other option is an optional input.
Creating your first Angular Chart
Here is a complete bar chart. Because the component is standalone, the template and logic live in one file:
import { Component, signal } from "@angular/core";
import {
  ChartComponent,
  ApexAxisChartSeries,
  ApexChart,
  ApexXAxis,
  ApexTitleSubtitle,
} from "ng-apexcharts";

@Component({
  selector: "app-root",
  imports: [ChartComponent],
  template: `
    <apx-chart
      [series]="series()"
      [chart]="chart"
      [xaxis]="xaxis"
      [title]="title"
    />
  `,
})
export class AppComponent {
  readonly series = signal<ApexAxisChartSeries>([
    { name: "My-series", data: [10, 41, 35, 51, 49, 62, 69, 91, 148] },
  ]);

  readonly chart: ApexChart = { type: "bar", height: 350 };
  readonly title: ApexTitleSubtitle = { text: "My First Angular Chart" };
  readonly xaxis: ApexXAxis = {
    categories: ["Jan", "Feb", "Mar", "Apr", "May", "Jun", "Jul", "Aug", "Sep"],
  };
}
This renders the following chart. To read more about the options you can configure in a bar chart, check out the plotOptions.bar configuration. 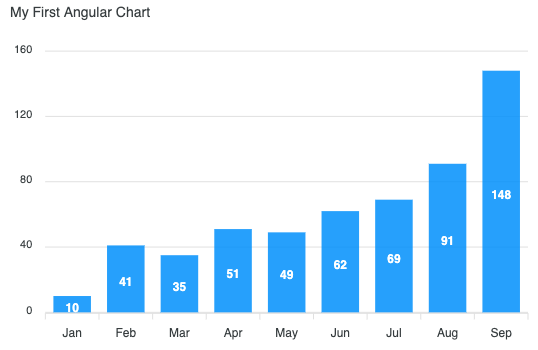
Updating Angular Chart Data
Set a new value on the signal and the chart updates itself. You do not need to call updateSeries() or updateOptions() manually:
@Component({
  selector: "app-root",
  imports: [ChartComponent],
  template: `
    <apx-chart [series]="series()" [chart]="chart" />
    <button (click)="randomize()">Randomize</button>
  `,
})
export class AppComponent {
  readonly series = signal<ApexAxisChartSeries>([
    { name: "series-1", data: [44, 55, 13, 33] },
  ]);

  readonly chart: ApexChart = { type: "bar", height: 350 };

  randomize() {
    this.series.set([{ name: "series-1", data: [23, 44, 1, 22] }]);
  }
}
Changing only series runs the cheap updateSeries() path: the chart animates in place and keeps the same instance. Changing any other option rebuilds the chart. If both change in the same tick, the rebuild happens once.
Set [autoUpdateSeries]="false" to always rebuild instead of updating in place. That matters for mixed/combo charts where you change the type inside the series objects themselves.
Plain (non-signal) properties work too. Any bound input change is picked up, so [series]="mySeries" with a reassigned array behaves the same way.
All Options
Each input maps to the matching key of the ApexCharts config object. All of them are signal inputs:
| Input | Type |
|---|---|
chart | ApexChart |
series | ApexAxisChartSeries | ApexNonAxisChartSeries |
annotations | ApexAnnotations |
colors | any[] |
dataLabels | ApexDataLabels |
stroke | ApexStroke |
labels | string[] |
legend | ApexLegend |
markers | ApexMarkers |
noData | ApexNoData |
parsing | ApexParsing |
fill | ApexFill |
tooltip | ApexTooltip |
plotOptions | ApexPlotOptions |
responsive | ApexResponsive[] |
xaxis | ApexXAxis |
yaxis | ApexYAxis | ApexYAxis[] |
forecastDataPoints | ApexForecastDataPoints |
grid | ApexGrid |
states | ApexStates |
title | ApexTitleSubtitle |
subtitle | ApexTitleSubtitle |
theme | ApexTheme |
autoUpdateSeries | boolean (default true) |
Calling chart methods
Every ApexCharts method is proxied through the component, so you never touch the DOM. Get a reference with viewChild:
import { Component, viewChild } from "@angular/core";
import { ChartComponent } from "ng-apexcharts";

@Component({
  selector: "app-root",
  imports: [ChartComponent],
  template: `
    <apx-chart [series]="series" [chart]="chart" />
    <button (click)="toggle()">Toggle series</button>
  `,
})
export class AppComponent {
  private readonly chartRef = viewChild.required(ChartComponent);

  readonly chart = { type: "line" as const, height: 350 };
  readonly series = [{ name: "Revenue", data: [10, 41, 35, 51] }];

  toggle() {
    this.chartRef().toggleSeries("Revenue");
  }
}
The component also exposes chartInstance as a signal, so you can react to the underlying ApexCharts object declaratively:
readonly isRendered = computed(() => this.chartRef().chartInstance() !== null);
The chartReady output emits { chartObj } after each successful render.
Available methods: render, updateOptions, updateSeries, appendSeries, appendData, highlightSeries, toggleSeries, showSeries, hideSeries, resetSeries, zoomX, toggleDataPointSelection, destroy, setLocale, paper, addXaxisAnnotation, addYaxisAnnotation, addPointAnnotation, removeAnnotation, clearAnnotations, dataURI. See the methods reference for details.
Reducing bundle size
Use <apx-chart-core> instead of <apx-chart> to load the ApexCharts core bundle (~611 KB) instead of the full bundle (~942 KB), then register only the chart types you need:
import "apexcharts/line";             // line, area, scatter, bubble
import "apexcharts/bar";              // bar, column, rangeBar
import "apexcharts/features/legend";  // opt-in legend
import "apexcharts/features/toolbar"; // opt-in toolbar

import { Component } from "@angular/core";
import { ChartCoreComponent } from "ng-apexcharts";

@Component({
  selector: "app-lean-chart",
  imports: [ChartCoreComponent],
  template: `<apx-chart-core [chart]="chart" [series]="series" />`,
})
export class LeanChartComponent {
  readonly chart = { type: "line" as const, height: 350 };
  readonly series = [{ name: "Revenue", data: [10, 41, 35, 51] }];
}
All inputs, outputs, and methods are identical to <apx-chart>.
Server-Side Rendering
ng-apexcharts supports Angular SSR through two companion components. <apx-chart-ssr> renders a static SVG on the server, and <apx-chart-hydrate> attaches interactivity on the client. Place them in the same container:
import { Component } from "@angular/core";
import { ChartSSRComponent, ChartHydrateComponent, ApexOptions } from "ng-apexcharts";

@Component({
  selector: "app-ssr-chart",
  imports: [ChartSSRComponent, ChartHydrateComponent],
  template: `
    <apx-chart-ssr [options]="chartOptions" [width]="800" [height]="400" />
    <apx-chart-hydrate [clientOptions]="{ chart: { animations: { enabled: true } } }" />
  `,
})
export class SsrChartComponent {
  readonly chartOptions: ApexOptions = {
    chart: { type: "line" },
    series: [{ name: "Revenue", data: [10, 41, 35, 51] }],
  };
}
The options input takes a single ApexOptions object with all chart config combined. clientOptions is merged during hydration and is useful for options that only make sense in the browser, such as animations and tooltips.
For full control, inject ChartSSRService and render to a string yourself:
const html = await chartSSRService.renderToHTML(options, { width: 800, height: 400 });
const svg = await chartSSRService.renderToString(options, { width: 800, height: 400 });
Using NgModules
New code should import the standalone components directly. If your application is still NgModule-based, NgApexchartsModule re-exports all four components:
import { NgApexchartsModule } from "ng-apexcharts";

@NgModule({
  imports: [NgApexchartsModule],
})
export class AppModule {}
It exists only for backwards compatibility. Do not pass it to importProvidersFrom() in a standalone application: it declares no providers, so that has no effect and leaves <apx-chart> unresolved in your templates.
More Charts Examples?
There are several other charts that can be created by changing a couple of options. More than 80+ samples can be found on the Angular Chart Demos page.
Need Advanced Chart Features?
We partnered with Infragistics to give you access to their comprehensive Angular Charts Library. It includes 65+ real-time charts, including Pie Chart, Line Chart, Bar Chart, Donut Chart, Treemap, and even Stock Charts, that provide the same features as the ones you come across with Google Finance and Yahoo Finance Charts. Using Ignite UI for Angular charts when working on your project, you can apply deep analytics, render millions of data points in milliseconds, and provide great UX to end-users.
With many useful Angular chart features like animations, annotations, axis gridlines, chart overlays, chart highlighting, and others, you can build better data-driven, mission-critical web and mobile apps in Angular. The Angular Charts component by Infragistics delivers stunning dashboards and enables you to craft interactive charts and graphs that are designed for speed, functionality, and seamless performance on every modern browser.